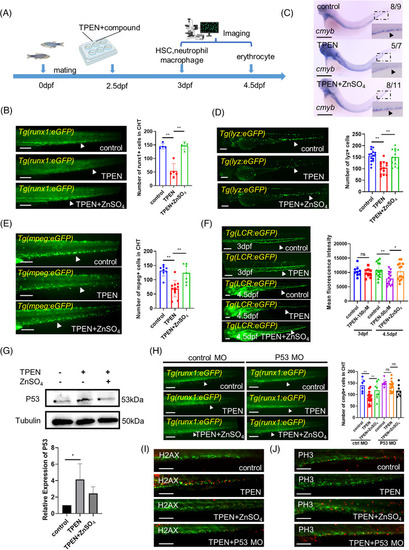
N,N,N′,N′‐tetrakis(2‐pyridylmethyl)ethylenediamine (TPEN)‐induced P53‐dependent hematopoietic defects in zebrafish: (A) timeline of TPEN modeling and observation time points for all hematopoietic lineages; (B) representative images of hematopoietic stem cells (HSCs) in control and TPEN (150 μM)‐treated Tg(runx1: eGFP) embryos with or without zinc incubation (100 μM) for 12 h. The quantitative results are shown in the right panel; (C) whole in situ hybridization showing the transcriptional expression of cmyb. The numbers at the top‐right corner show the number of embryos with representative phenotypes/the total number of embryos in the group. Positive stained cells are pointed by a black arrowhead in the zoomed inset. (D and E) Representative images of neutrophils in Tg(lyz:eGFP) embryos (D) and macrophages in Tg(mpeg:eGFP) embryos (E). The quantitative results are shown in the right panels; (F) representative images of red blood cells in Tg(LCR:eGFP) embryos at 3 and 4.5 dpf, respectively; (G) Western blot images and quantitative results showing P53 expression; (H) representative images and quantitative results showing the effect of tp53 morpholino microinjection on TPEN‐induced HSCs reduction compared to that of standard control morpholino; (I and J) immunostaining of H2AX‐labeled apoptotic cells (red signals in I) and PH3‐labeled of proliferating cells (red signals in J) in HSCs labeled (green signals) Tg(runx1: eGFP) zebrafish with different treatments. At least 7 embryos were included in each group; for Western blot experiments, 30 embryos in each group from three separate experiments were used; arrowheads in (B–F, H) pointed to the positive stained cell signals; scale bar (in B, D–F, H), 200 μm; scale bar (in C), 500 μm; scale bar (in I–J), 100 μm. hpf, hours post fertilization. *p < 0.05; **p < 0.01.
|

