- Title
-
Identification of the natural chalcone glycoside hydroxysafflor yellow A as a suppressor of P53 overactivation-associated hematopoietic defects
- Authors
- Chen, J., Ren, C., Yao, C., Baruscotti, M., Wang, Y., Zhao, L.
- Source
- Full text @ MedComm (Beijing)
|
|
|
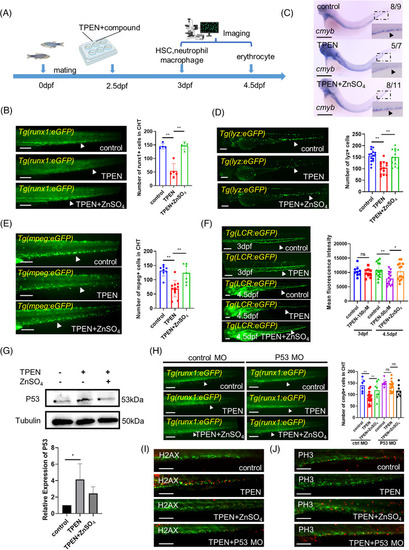
Phenotypic screening for hematopoietic‐protective compounds in |
|
Regulation of downstream hematopoietic lineages by hydroxysafflor yellow A (HSYA) in |
|
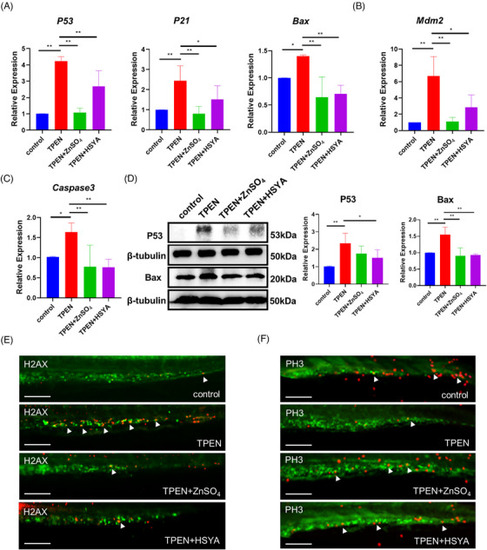
Hydroxysafflor yellow A (HSYA) downregulated P53 signaling and cell apoptosis in |
|
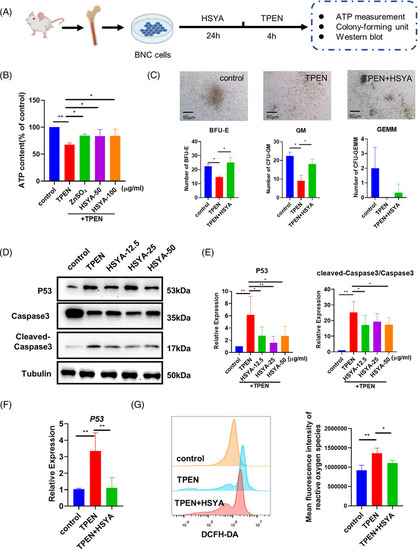
Hematopoietic‐promoting activity of hydroxysafflor yellow A (HSYA) on mice bone marrow nucleated cells: (A) experimental protocol of bone marrow nucleated cells (BNCs) extraction and drug treatment; (B) ATP content of control and |
|
Hydroxysafflor yellow A (HSYA) partially rescues hematopoietic defects in 5‐FU‐induced myelosuppression mice: (A) timeline of 5‐FU modeling and drug administration; (B) the number of bone marrow nucleated cells (BNCs) in the 5‐FU‐treated mice with or without HSYA administration on days 5 and 10. Each group had five mice; (C) peripheral blood analysis on days 5 and 10. Each group consisted of 3–5 mice; (D) quantitative result of hematopoietic colony‐forming unit (CFU) assay. * |
|
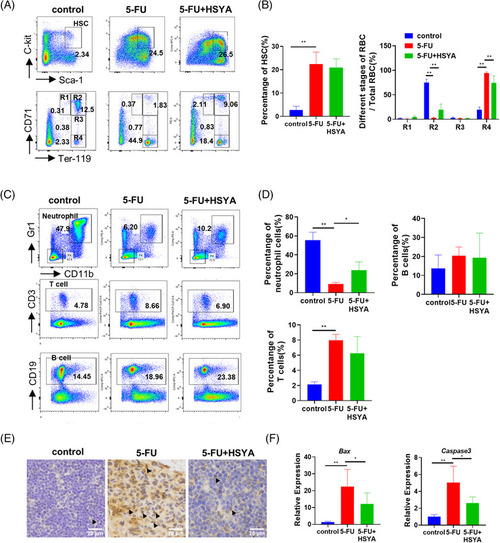
Hydroxysafflor yellow A (HSYA) partially repairs hematopoietic defects in 5‐FU‐treated mice: (A) flow cytometry in different treatment groups to detect the proportion of hematopoietic stem cells and the distribution of erythrocytes at different stages on day 10. LSK cells/hematopoietic stem cells (HSCs) (Lin‐Sca‐1+c‐kit+); proerythroblast/R1 (CD71highTer119intermediate); basophilic erythroblast (CD71highTer119high); polychromatic erythroblast (CD71intermediateTer119high); orthochromatic erythroblast (CD71lowTer119high); 5‐FU, 200 mg/kg; HSYA, 100 mg/kg; (B) quantitative result of flow cytometry; (C) flow cytometry to detect the proportion of neutrophils, T cells and B cells on day 10. Neutrophil (CD11b+Gr1+); T lymphocyte (CD3+); B lymphocyte (CD19+); (D) quantitative result of (C) for flow cytometry; three mice in each group for flow cytometry; (E) immunohistochemical staining of P53 in mouse thymus tissue. Arrowheads pointed to P53‐stained cells. Scale bar: 20 μm; (F) QPCR results showing the expression of Bax and Caspase3 in different mice treatment groups. * |


