|
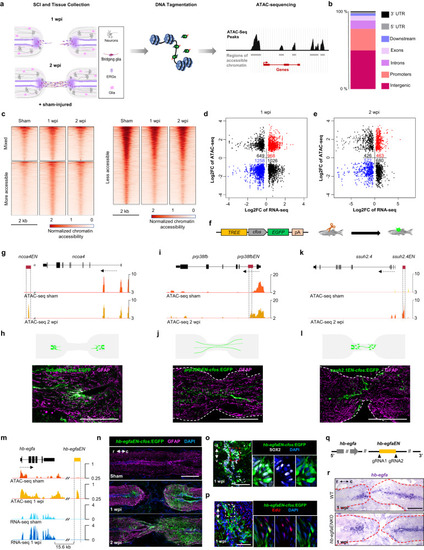
Chromatin profiling reveals an enhancer linked to hb-egfa that directs regeneration-associated gene expression. a Diagram with strategy used to identify spinal cord TREEs. b Bar plot showing the proportions of dynamic peaks during regeneration located within promoters, exons, introns, and intergenic regions. c Heat map of ATAC-seq signals in sham-injured, 1 and 2 weeks post injury (wpi) spinal cord tissue. Mixed peaks show different trends in 1 and 2 wpi samples, compared with the control. Cutoff is p value < 0.05 and fold change >1.2. Dot plot of differential ATAC-seq chromatin regions linked to nearby differential transcripts at 1 (d) and 2 wpi (e) vs. sham-injured spinal cords. Each point indicates a separate ATAC-seq peak. f Transgene used to assess in vivo TREE function. g, i, k Browser tracks indicating chromatin accessibility (dark and light orange) at the ncoa, prp38fb and ssuh2.4 locus. The candidate ncoa-linked enhancer ncoaEN, prp38fb-linked enhancer prp38fbEN and ssuh2.4-linked enhancer ssuh2.4EN are indicated with dashed lines. h, j, l Cartoon and immunofluorescence images showing injury-induced expression patterns directed by ncoaEN, prp38fb EN and ssuh2.4EN at 2 weeks post injury. m Browser tracks indicating chromatin accessibility (dark and light orange) and transcript levels (light and dark blue) at the hb-egfa locus, indicating the candidate hb-egfa-linked enhancer hb-egfaEN with dashed lines. hb-egfaEN is located 15.6 kb downstream of hb-egfa and increases accessibility during regeneration. n Longitudinal sections of hb-egfaEN-cfos:EGFP spinal cords showing induced EGFP at 1 and 2 wpi. Transverse section images indicating immunofluorescence for Sox2 (o) and EdU incorporation assay for cell cycling (p) in cells displaying hb-egfEN-directed EGFP expression at 1 wpi. q Strategy used to generate hb-egfaEN mutants. r In situ hybridization indicating grossly normal expression of hb-egfa mRNA in spinal cords of wild-type (WT) and hb-egfaEN mutant fish at 1 wpi. N = 2 in (h, j, l); N = 3 in (n–p, r). Scale bars 200 μm in (h, j, l, n, r), and 50 μm in (o, p). r rostral, c caudal, d dorsal, v ventral.
|