|
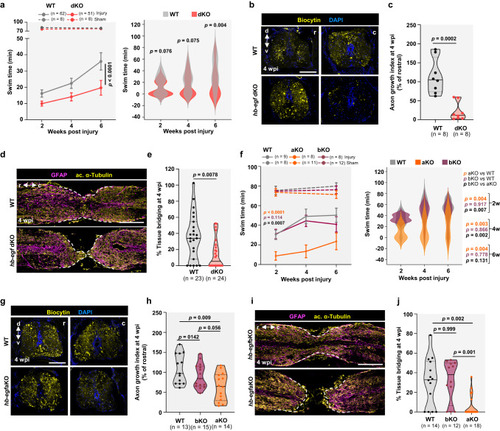
hb-egfa paralog is required for zebrafish spinal cord regeneration a Swim capacity of WT (gray) and dKO (red) animals at increasing currents. Data shown as line graphs at increasing timepoints (left) and overlapping violins at each timepoint (right). Two-way repeated-measures ANOVA tests with Holm-Šidák correction. p values for sham groups (left graph, dashed lines) are 0.711 and 0.783 at 2 and 6 weeks, respectively. p < 0.0001 in left panel represents comparison of performance over all timepoints. b Sections of WT and hb-egf dKO cords located rostral or caudal to transection site, after anterograde axon tracing at 4 wpi. Quantification in (c) N = 3. d Tissue sections indicating the glial marker GFAP (magenta) and axonal marker acetylated α-Tubulin (yellow) in WT and hb-egfdKO spinal cords at 4 wpi. Dashed lines delineate tissue bridging. Quantification in (e). N = 4. f Swim capacity assayed of WT (gray), hb-egfa (orange), or hb-egfb (dark red) animals. Data shown as line graphs at increasing timepoints (left) and overlapping violins at each timepoint (right). Two-way repeated-measures ANOVA tests with Holm-Šidák correction. p values for sham groups (left graph, dashed lines) are 0.730 and 0.236 for aKO vs. WT at 2 and 6 weeks, respectively; 0.862 and 0.681 for bKO vs. WT at 2 and 6 weeks, respectively; 0.830 and 0.562 for aKO vs. bKO at 2 and 6 weeks, respectively. p values shown in left graph represent comparison of performance over all timepoints for injured groups. g Sections of WT and hb-egfaKO spinal cords located rostral or caudal to transection site, after anterograde axon tracing at 4 wpi. Quantification in (h). N = 2. i Tissue sections indicating GFAP (magenta) and acetylated α-Tubulin (yellow) in hb-egfaKO or hb-egfbKO spinal cords at 4 wpi. Dashed lines delineate tissue bridging. Quantification in (j). N = 2. Scale bars 200 μm in (d, i), 100 μm in (b, g). Error bars in (a, f) (left graphs) indicate SEM. A two-tailed Mann–Whitney test was used for comparisons in (c, e, h, j). r rostral, c caudal, d dorsal, v ventral. n = number of animals used for the experiments. Source data provided as Source Data file.
|