|
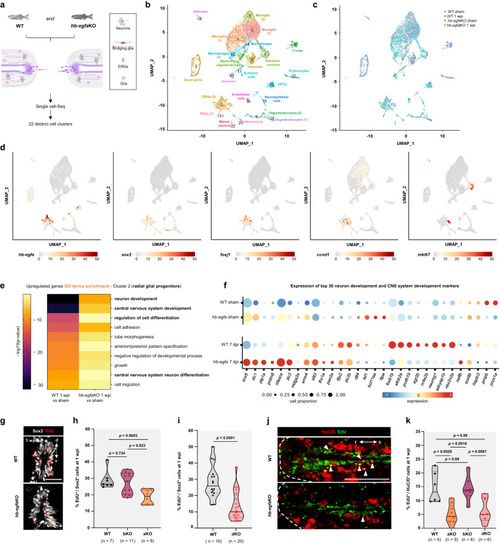
scRNA-seq identifies a role for Hb-egfa in stump neurogenesis during spinal cord repair. a Diagram with scRNA-Seq strategy. b UMAP showing clustering of scRNA-Seq data at 1 week post injury (wpi). c Cells from sham-injured and 1 wpi wild-type (WT) and hb-egfaKO spinal cords contribute similarly to all identified cell clusters. d Expression of hb-egfa and ERG marker genes in ERGs at 1 wpi. e Heatmap showing enriched GO terms at 1 wpi in radial glial progenitors of WT and hb-egfaKO spinal cords. f Expression of genes involved in neuronal differentiation and central nervous system development identified by GO analyses in WT and hb-egfaKO spinal cords. Dot size represents the percentage of positive cells for each gene, and dot color represents the expression level. Top 30 genes ordered by p value are shown. g Transverse sections of WT and hb-egfaKO spinal cords at 1 wpi, stained for ependymal cells (Sox2+, white) and EdU (red) incorporation. h Quantification of Sox2+ ependymal cell cycling at 1 wpi in WT, hb-egfaKO, or hb-egfbKO fish. N = 2. i Quantification of cycling ependymal cells in WT and hb-egf dKO spinal cords at 1 wpi. N = 3. j Longitudinal sections of WT and hb-egfaKO spinal cords at 1 wpi, stained for the neuronal marker HuC/D (red) and the cycling marker EdU (green). Arrowheads indicate EdU-labeled cells, and dashed line delineates the spinal cord stumps. k Quantification of neurons with EdU labeling in WT, hb-egfaKO, hb-egfbKO and hb-egf dKO cords at 1 wpi. N = 3. Scale bars 50 μm in (g), 200 μm in (j). A two-tailed Mann–Whitney test was used for comparisons in (h, i, k). r rostral, c caudal, d dorsal, v ventral. n = number of animals used for the experiments. Source data are provided as a Source Data file.
|