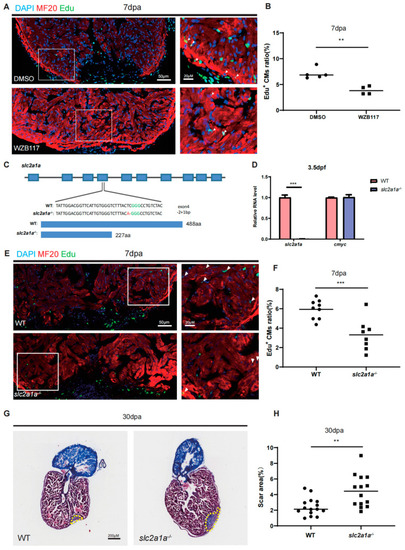
Depletion of Glut1 impairs zebrafish heart regeneration. (A) Cryosections of Edu-labelled (in green) zebrafish injury hearts with different treatments at 7 dpa were immunostained by anti-MF20 (in red). The nuclei were stained with DAPI (in blue). The zebrafish with heart resections were intraperitoneally injected with DMSO (the injection control) or WZB117. Framed areas were magnified in the right panels. Scale bar: 50 μm or 20 μm as indicated. (B) Statistical analyses of EDU+ CMs in A. The EDU+ CMs were presented as the percentage of the total MF20+ cells at the injury sites. Each dot represents an individual heart (round dot, DMSO injection group; frame dot, WZB117 injection group). n: 4–5 hearts/sample. The experiment was repeated three times. (C) Diagram showing the gRNA targeting site and two-bp deletion and one-bp insertion in the exon 4 of the slc2a1a mutant, which results in a premature stop codon (PTC) at 227 aa (the GGG in green is the PAM sequence). (D) qRT-PCR was performed to examine the expression of slc2a1a and cmyc in WT and slc2a1a−/− mutant embryos at 3.5 dpf. (E) Immunostaining of MF20 (in red) and EDU incorporation assay (in green) of WT and slc2a1a−/− injury hearts at 7 dpa. Framed areas were magnified in the right panels. Scale bar: 50 μm or 20 μm as indicated. (F) Statistical analyses of EDU+ CMs in C. The EDU+ CMs were presented as the percentage of the total MF20+ cells at the injury sites. Each dot represents an individual heart (round dot, WT group; frame dot, slc2a1a−/− group). n: 8–9 hearts/sample. The experiment was repeated two times. (G) Fibrin clot stained with Masson’s trichrome on the cryosections of WT and slc2a1a−/− injury hearts at 30 dpa. Yellow dotted lines indicate the approximate injury area. Scale bar: 200 μm. (H) Statistical analyses of scar areas in (E). Average injury area with fibrin clots on heart sections was presented as the percentage of the total ventricular area. Each dot represents an individual heart (round dot, WT group; frame dot, slc2a1a−/− group). n: 14–15 hearts/sample. Statistical analysis was performed by Student’s two-tailed unpaired t test in GraphPad Prism 8. The p values were represented by n.s. and asterisks. **, p < 0.01; ***, p < 0.001.
|

