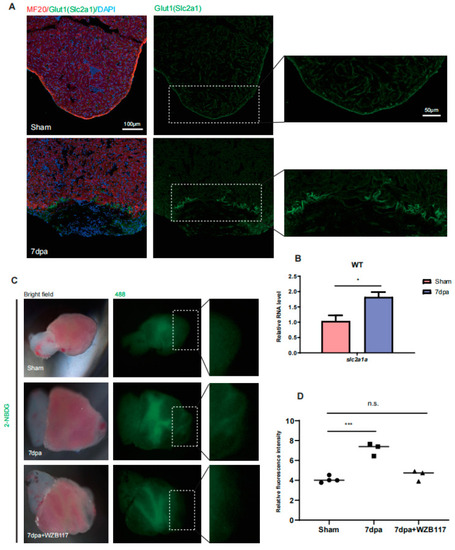
Glut1 expression and glucose uptake are upregulated around injury area of zebrafish hearts. (A) Immunostaining of MF20 (in red) and Glut1 (in green) in sham and injured hearts at 7 dpa. The nuclei were stained with DAPI (in blue). Framed areas were magnified in right panels. n: 5–6 hearts/sample. Scale bar: 100 μm or 50 μm as indicated. The experiment was repeated two times. (B) qRT-PCR was performed to examine the expression of slc2a1a in sham and injury (7 dpa) hearts. (C,D) Ex vivo glucose uptake assay. The ventricles were isolated from sham and injury hearts at 7 dpa. The isolated ventricles were incubated in 2-NBDG (a fluorescent derivative of glucose) solution for 1h, and treated with or without WZB117, a Glut1 inhibitor. The treated ventricles were captured in bright field (left panels) or 488 Channel (right panels) with a fluorescence microscope (C). The jelly-like tissues observed in the bright field images were injury areas. Framed areas were injury sties and were magnified in the right panels. The relative fluorescence intensity of the heart apex was analyzed with Image J (D). Each dot represents an individual heart (round dot, Sham group; frame dot, 7dpa group; triangle dot, 7dpa with WZB117 treatment group). n: 3–4 hearts/sample. The experiment was repeated three times. Statistical analysis was performed by Student’s two-tailed unpaired t test in GraphPad Prism 8. The p values were represented by n.s. and asterisks. n.s., p > 0.05; *, p < 0.05; ***, p < 0.001.

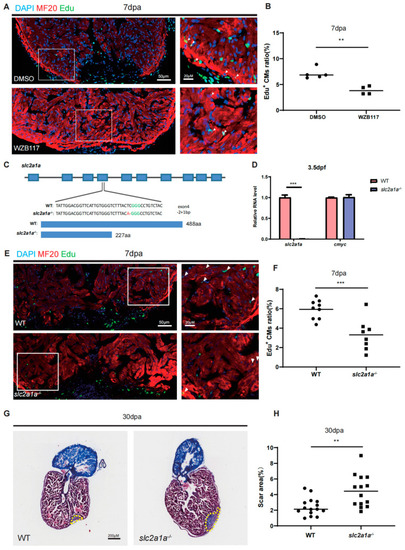
Depletion of Glut1 impairs zebrafish heart regeneration. (A) Cryosections of Edu-labelled (in green) zebrafish injury hearts with different treatments at 7 dpa were immunostained by anti-MF20 (in red). The nuclei were stained with DAPI (in blue). The zebrafish with heart resections were intraperitoneally injected with DMSO (the injection control) or WZB117. Framed areas were magnified in the right panels. Scale bar: 50 μm or 20 μm as indicated. (B) Statistical analyses of EDU+ CMs in A. The EDU+ CMs were presented as the percentage of the total MF20+ cells at the injury sites. Each dot represents an individual heart (round dot, DMSO injection group; frame dot, WZB117 injection group). n: 4–5 hearts/sample. The experiment was repeated three times. (C) Diagram showing the gRNA targeting site and two-bp deletion and one-bp insertion in the exon 4 of the slc2a1a mutant, which results in a premature stop codon (PTC) at 227 aa (the GGG in green is the PAM sequence). (D) qRT-PCR was performed to examine the expression of slc2a1a and cmyc in WT and slc2a1a−/− mutant embryos at 3.5 dpf. (E) Immunostaining of MF20 (in red) and EDU incorporation assay (in green) of WT and slc2a1a−/− injury hearts at 7 dpa. Framed areas were magnified in the right panels. Scale bar: 50 μm or 20 μm as indicated. (F) Statistical analyses of EDU+ CMs in C. The EDU+ CMs were presented as the percentage of the total MF20+ cells at the injury sites. Each dot represents an individual heart (round dot, WT group; frame dot, slc2a1a−/− group). n: 8–9 hearts/sample. The experiment was repeated two times. (G) Fibrin clot stained with Masson’s trichrome on the cryosections of WT and slc2a1a−/− injury hearts at 30 dpa. Yellow dotted lines indicate the approximate injury area. Scale bar: 200 μm. (H) Statistical analyses of scar areas in (E). Average injury area with fibrin clots on heart sections was presented as the percentage of the total ventricular area. Each dot represents an individual heart (round dot, WT group; frame dot, slc2a1a−/− group). n: 14–15 hearts/sample. Statistical analysis was performed by Student’s two-tailed unpaired t test in GraphPad Prism 8. The p values were represented by n.s. and asterisks. **, p < 0.01; ***, p < 0.001.

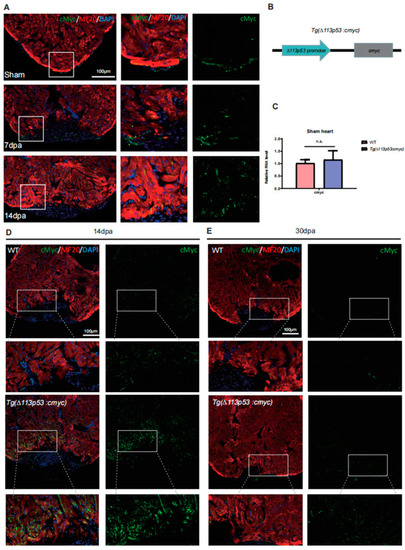
The expression of cMyc is activated around the injury site of zebrafish hearts, which is excessively upregulated in Tg(Δ113p53:cmyc) transgenic zebrafish injury hearts. (A) Immunostaining of MF20 (in red) and cMyc (in green) in WT sham and injury hearts at 7 and 14 dpa. Framed areas were magnified in right panels. n: 8–11 hearts/sample. Scale bar: 100 μm. (B) Diagram showing the construction of Tg(∆113p53:cmyc) transgene. (C) qRT-PCR was performed to exam the expression of cmyc in WT and Tg(∆113p53:cmyc) sham hearts. (D,E) Immunostaining of MF20 (in red) and cMyc (in green) of WT and Tg(∆113p53:cmyc) hearts at 14 dpa (D) and 30 dpa (E). Framed areas were magnified in lower panels. n: 10–12 hearts/sample. Scale bar: 100 μm. Statistical analysis was performed by Student’s two-tailed unpaired t test in GraphPad Prism 8. The p values were represented by n.s. and asterisks. n.s., p > 0.05.

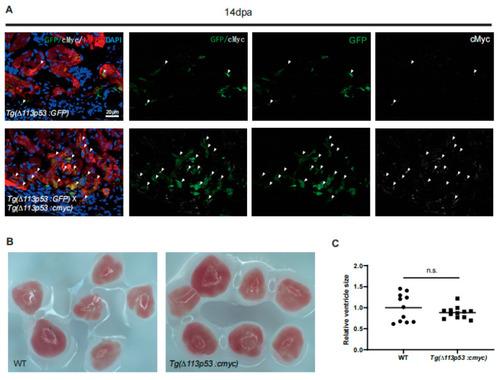
cMyc is conditionally overexpressed in ∆113p53+ CMs in Tg(∆113p53:cmyc) zebrafish hearts. (A) Immunostaining of MF20 (in red), GFP (in green) and cMyc (in white) in Tg(∆113p53:GFP) single and Tg(Δ113p53:cmyc);(TgΔ113p53:GFP) double transgenic zebrafish hearts at 14 dpa. Scale bar: 20 μm. n: 11–12 hearts/sample. (B,C) Representative pictures of WT and Tg(∆113p53:cmyc) adult zebrafish hearts (B). The statistical analysis of the average ventricle sizes of Tg(∆113p53:cmyc) and WT adult zebrafish is shown in (C). Each dot represents an individual heart (round dot, WT group; frame dot, Tg(∆113p53:cmyc) group). n: 11–12 hearts/sample. Statistical analysis was performed by Student’s two-tailed unpaired t test in GraphPad Prism 8. The p values were represented by n.s. and asterisks. n.s., p > 0.05.

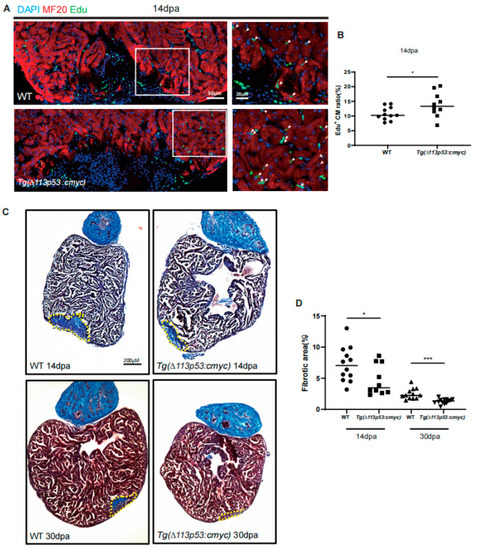
Conditional overexpression of cmyc in ∆113p53+ cells promotes zebrafish CM proliferation and heart regeneration. (A) Immunostaining of MF20 (in red) and EDU incorporation assay (in green) of WT and Tg(∆113p53:cmyc) injury hearts at 14 dpa. Framed areas were magnified in right panels. Scale bar: 50 μm or 20 μm as indicated. (B) Statistical analyses of EDU+ CMs in A. The EDU+ CMs were presented as the percentage of the total MF20+ cells at the injury sites. Each dot represents an individual heart (round dot, WT group; frame dot, Tg(∆113p53:cmyc) group). n: 10–11 hearts/sample. The experiment was repeated three times. (C) Fibrin clot stained with Masson’s trichrome on the cryosections of WT and Tg(∆113p53:cmyc) injury hearts at 14 and 30 dpa. Yellow dotted lines indicate the approximate injury area. Scale bar: 200 μm. (D) Statistical analyses of scar areas in (C). Average injury area with fibrin clots on heart sections was presented as the percentage of the total ventricular area. Each dot represents an individual heart (round dot, WT at 14 dpa group; frame dot, Tg(∆113p53:cmyc) at 14 dpa group; positive triangle dot, WT at 30 dpa group; inverted triangle dot, Tg(∆113p53:cmyc) at 30 dpa group). n: 10–12 hearts/sample. Statistical analysis was performed by Student’s two-tailed unpaired t test in GraphPad Prism 8. The p values were represented by n.s. and asterisks. *, p < 0.05; ***, p < 0.001.

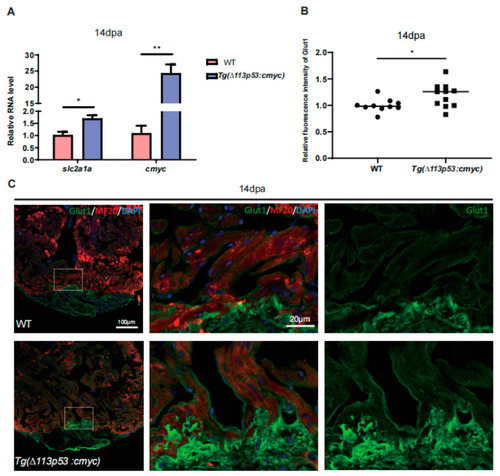
Conditional overexpression of cmyc in ∆113p53+ cells activates Glut1 expression. (A) qRT-PCR was performed to examine the expression of slc2a1a and cmyc in WT and Tg(∆113p53:cmyc) injury hearts at 14 dpa. (B,C) Immunostaining of MF20 (in red) and Glut1 (in green) in WT and Tg(∆113p53:cmyc) injury hearts at 14 dpa (C) and statistical analyses of Glut1 relative fluorescence intensity around the injury site in (C). (B). Framed areas were magnified in right panels. Each dot represents an individual heart (round dot, WT group; frame dot, Tg(∆113p53:cmyc) group). n: 10–11 hearts/sample. Scale bar: 100 μm or 20 μm as indicated. The experiment was repeated two times. Statistical analysis was performed by Student’s two-tailed unpaired t test in GraphPad Prism 8. The p values were represented by n.s. and asterisks. *, p < 0.05; **, p < 0.01.

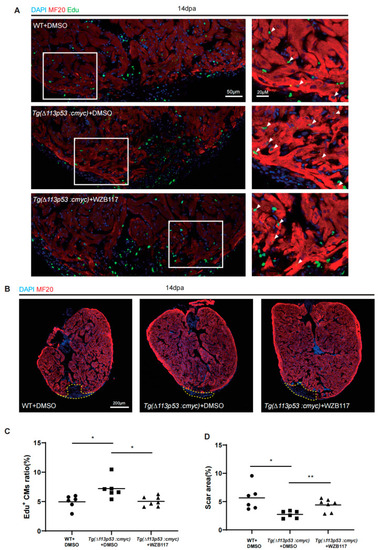
Conditional overexpression of cmyc in ∆113p53+ cells promotes heart regeneration dependent on Glut1. (A) Immunostaining of MF20 (in red) and EDU incorporation assay (in green) of injury hearts at 14 dpa in WT and Tg(∆113p53:cmyc) zebrafish intraperitoneally injected with DMSO (the injection control) or WZB117. The nuclei were stained with DAPI (in blue). Framed areas were magnified in right panels. Scale bar: 50 μm or 20 μm as indicated. (B) Immunostaining of MF20 (in red) of injury hearts at 14 dpa in WT and Tg(∆113p53:cmyc) zebrafish intraperitoneally injected with DMSO (the injection control) or WZB117. The nuclei were stained with DAPI (in blue). Scale bar: 200 μm. (C) Statistical analyses of EDU+ CMs in (A). The EDU+ CMs were presented as the percentage of the total MF20+ cells at the injury sites. Each dot represents an individual heart (round dot, WT with DMSO injection group; frame dot, Tg(∆113p53:cmyc) with DMSO injection group; triangle dot, Tg(∆113p53:cmyc) with WZB117 injection group). n: 6–7 hearts/sample. The experiment was repeated two times. (D) Statistical analyses of scar areas in (B). Average injury area without MF20 signals on heart sections was presented as the percentage of the total ventricular area. Each dot represents an individual heart (round dot, WT with DMSO injection group; frame dot, Tg(∆113p53:cmyc) with DMSO injection group; triangle dot, Tg(∆113p53:cmyc) with WZB117 injection group). n: 6–7 hearts/sample. The experiment was repeated two times. Statistical analysis was performed by Student’s two-tailed unpaired t test in GraphPad Prism 8. The p values were represented by n.s. and asterisks. *, p < 0.05; **, p < 0.01.

Acknowledgments
This image is the copyrighted work of the attributed author or publisher, and ZFIN has permission only to display this image to its users. Additional permissions should be obtained from the applicable author or publisher of the image. Full text @ J Cardiovasc Dev Dis