
Fig. 1
- ID
- ZDB-FIG-230605-1
- Publication
- Wu et al., 2022 - Assessment of stromal SCD-induced drug resistance of PDAC using 3D-printed zPDX model chips
- Other Figures
- All Figure Page
- Back to All Figure Page
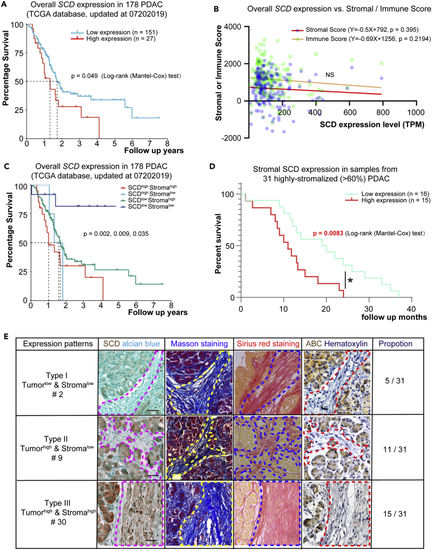
Expression patterns and prognosis value of SCD in PDAC samples (A) Kaplan-Meier curves for OS in TCGA cohort (N = 176) with PDAC based on SCD expression levels. (B) Correlation between the SCD expression levels and Stromal/Immune Scores (ESTIMATE). (C) Kaplan-Meier curves for OS in TCGA cohort with PDAC based on SCD expression and stromal score (ESTIMATE). (D) Kaplan-Meier curves for OS in 31 patients with stroma-enriched PDAC based on SCD expression levels. The differences between the two curves were determined by the log rank (Mantel) test. (E) Phenotyping of the stroma-enriched PDAC samples, based on the staining of series sections, which were, from left to right, Alcian blue, SCD antibody, Masson staining, Sirius red staining, activated β-catenin antibody, and Hematoxylin. Scale bar: 20 μm. p < 0.05 was considered significant. |