
|
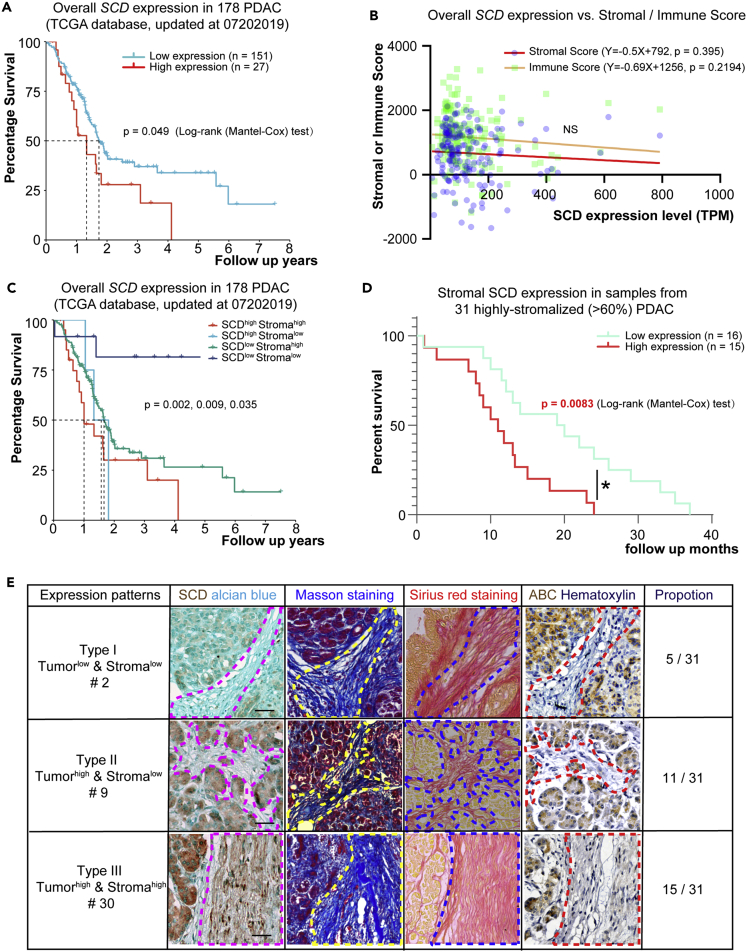
Fig. 1
Expression patterns and prognosis value of SCD in PDAC samples
(A) Kaplan-Meier curves for OS in TCGA cohort (N = 176) with PDAC based on SCD expression levels.
(B) Correlation between the SCD expression levels and Stromal/Immune Scores (ESTIMATE).
(C) Kaplan-Meier curves for OS in TCGA cohort with PDAC based on SCD expression and stromal score (ESTIMATE).
(D) Kaplan-Meier curves for OS in 31 patients with stroma-enriched PDAC based on SCD expression levels. The differences between the two curves were determined by the log rank (Mantel) test.
(E) Phenotyping of the stroma-enriched PDAC samples, based on the staining of series sections, which were, from left to right, Alcian blue, SCD antibody, Masson staining, Sirius red staining, activated ?-catenin antibody, and Hematoxylin. Scale bar: 20 ?m. p < 0.05 was considered significant.