Fig. S1
|
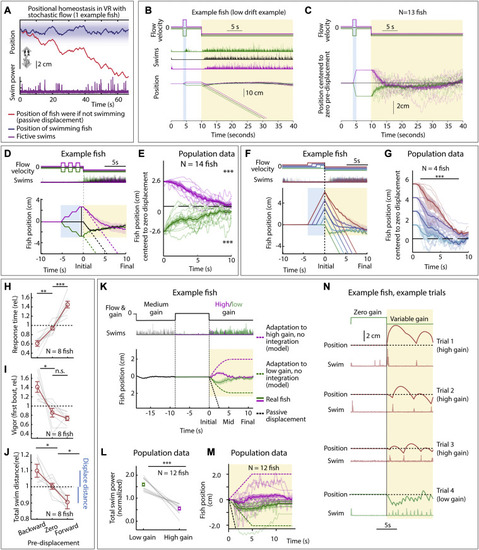
Positional homeostasis, extended characterization, related to Figure 1 (A) Positional homeostasis example, in which an example fish approximately stabilizes its location in a stochastic virtual water current. (B) Positional homeostasis assay with a 30-s swim period in an example fish. (C) Centered trajectories for N = 13 fish showing persistent convergence. (D) Triple forward pre-displacement/backward pre-displacement assay. Example fish, showing converging trajectories, indicating successful integration across three consecutive pre-displacements. (Shaded regions: SEM in all panels.) (E) Population data (14 fish) showing near-complete correction for earlier pre-displacement. (One-sample t test, ???p < 0.001, p = 9.7e?10 for forward pre-displacements, p = 1.9e?10 for backward pre-displacement. Error bars: SEM in all panels.) (F) Assay to test integration over varying durations. An example fish successfully integrates pre-displacement and corrects for it in the swim period. (G) Population data (4 fish) showing accurate correction, i.e., path integration. (Two-tailed paired t test, ???p < 0.001, p = 1.08e?7 for all forward pre-displacements.) (H) Animals respond faster (slower) after a backward (forward) pre-displacement, consistent with Figure 1F. (Two-tailed paired t test, ??p < 0.01, p = 1.76e?3 for backward pre-displacement, ???p < 0.001, p = 3.1e?4 for forward pre-displacement.) (I) Animals respond more vigorously after a backyard pre-displacement, consistent with Figure 1F. (Two-tailed paired t test, ?p < 0.05, p = 0.0151 for backward pre-displacement, n.s. p > 0.05, p = 0.115 for forward pre-displacement.) (J) Total swim distance (normalized) corresponds to the earlier pre-displacement, consistent with Figure 1F. (Two-tailed paired t test, ?p < 0.05, p = 0.031 for backward pre-displacements, and p = 0.012 for forward pre-displacements.) (K) After motosensory gain changes (high: ×1.5, low: ×0.5), animals still integrate position. Dashed lines: position of model fish performing gain adaptation (linear adjustment of vigor over 5 s) but no path integration. Solid lines: position of real fish. (L) Swim vigor during low or high motosensory gain shows gain adaptation. (Two-tailed paired t test, ???p < 0.001, p = 1.6e?5.) (M) Average fish position in low versus high gain trails initially diverges, then converges. Dashed lines: normalization to model fish performing gain adaptation but no path integration. (N) Example trials during high and low motosensory gain (data from K?M) showing accurate positional homeostasis in both cases. |
Reprinted from Cell, 185, Yang, E., Zwart, M.F., James, B., Rubinov, M., Wei, Z., Narayan, S., Vladimirov, N., Mensh, B.D., Fitzgerald, J.E., Ahrens, M.B., A brainstem integrator for self-location memory and positional homeostasis in zebrafish, 50115027.e205011-5027.e20, Copyright (2022) with permission from Elsevier. Full text @ Cell

