Fig. 3
- ID
- ZDB-FIG-230330-4
- Publication
- Huang et al., 2022 - De novo establishment of circuit modules restores locomotion after spinal cord injury in adult zebrafish
- Other Figures
- All Figure Page
- Back to All Figure Page
|
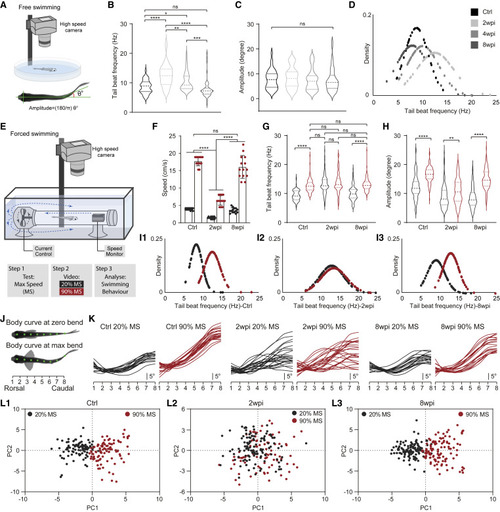
Figure 3. The stepwise restoration of high- and low-rhythm locomotion in SCI animals (A) Drawing of free-swimming monitoring setup and the calculation of tail-beat amplitude. (B and C) Population data of tail-beat frequency and amplitude during free-swimming in SCI animals at 2, 4, and 8 wpi, and in uninjured fish. Ctrl N = 12 fish, n = 37 swimming bouts (SBs); 2 wpi N = 17 fish, n = 39 SBs; 4 wpi N = 16 fish, n = 50 SBs; 8 wpi N = 20 fish, n = 49 SBs. (D) Density distribution of tail-beat frequency during free-swimming. n = 40 SBs (Ctrl), n = 44 SBs (2 wpi), n = 54 SBs (4 wpi), n = 51 SBs (8 wpi). (E) Drawing of forced-swimming control/monitoring setup and design of the behavior assay. (F) Quantification of 20% (black) or 90% (red) maximum speed (MS) for SCI animals at 2 and 8 wpi and uninjured animals. One dot equals one fish. (G?H) Population data of tail-beat frequency and amplitude during forced-swimming at either 20% (black) or 90% (red) MS. Ctrl N = 10 fish, n = 112 (20% MS) or n = 120 (90% MS) SBs; 2 wpi N = 10 fish, n = 117 (20% MS) or n = 102 (90% MS) SBs; 8 wpi N = 11 fish, n = 117 (20% MS) or n = 121 (90% MS) SBs. (I) Density distribution of tail beat frequency during forced-swimming under 20% (black) or 90% (red) MS, respectively. n = 112 (Ctrl 20% MS), n = 121 (Ctrl 20% MS), n = 118 (2 wpi 20% MS), n = 106 (2 wpi 90% MS), n = 119 (8 wpi 20% MS), n = 123 (8 wpi 90% MS) SBs. (J) Illustration of body curvature measurements made using eight markers placed on the long body axis at rest or maximum bending during a single SB. (K) Typical traces of body curvature at maximum bending during forced-swimming cycles at 20% (black) or 90% (red) MS for control and SCI animals. n = 20 (Ctrl 20% MS), n = 21 (Ctrl 20% MS), n = 25 (2 wpi 20% MS), n = 25 (2 wpi 90% MS), n = 18 (8 wpi 20% MS), n = 20 (8 wpi 90% MS) SBs. (L) Principal-component analysis of locomotor pattern during forced-swimming at 20% or 90% MS for SCI animals at 2 wpi (L2) and 8 wpi (L3), and in uninjured ones (L1). Each dot equals one SB from N = 10 (Ctrl), N = 10 (2 wpi), and N = 11 (8 wpi) fish. All data are presented as mean ± SD. ?p < 0.05, ??p < 0.01, ???p < 0.001, ????p < 0.0001, significant difference. See also Figure S3. |

