Fig. 3
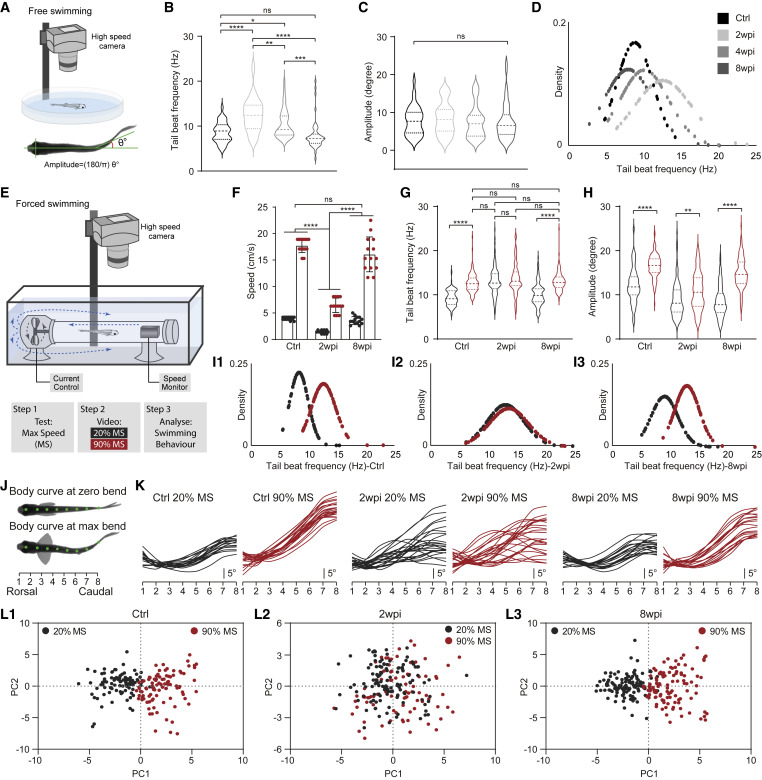
Figure 3. The stepwise restoration of high- and low-rhythm locomotion in SCI animals (A) Drawing of free-swimming monitoring setup and the calculation of tail-beat amplitude. (B and C) Population data of tail-beat frequency and amplitude during free-swimming in SCI animals at 2, 4, and 8 wpi, and in uninjured fish. Ctrl N = 12 fish, n = 37 swimming bouts (SBs); 2 wpi N = 17 fish, n = 39 SBs; 4 wpi N = 16 fish, n = 50 SBs; 8 wpi N = 20 fish, n = 49 SBs. (D) Density distribution of tail-beat frequency during free-swimming. n = 40 SBs (Ctrl), n = 44 SBs (2 wpi), n = 54 SBs (4 wpi), n = 51 SBs (8 wpi). (E) Drawing of forced-swimming control/monitoring setup and design of the behavior assay. (F) Quantification of 20% (black) or 90% (red) maximum speed (MS) for SCI animals at 2 and 8 wpi and uninjured animals. One dot equals one fish. (G?H) Population data of tail-beat frequency and amplitude during forced-swimming at either 20% (black) or 90% (red) MS. Ctrl N = 10 fish, n = 112 (20% MS) or n = 120 (90% MS) SBs; 2 wpi N = 10 fish, n = 117 (20% MS) or n = 102 (90% MS) SBs; 8 wpi N = 11 fish, n = 117 (20% MS) or n = 121 (90% MS) SBs. (I) Density distribution of tail beat frequency during forced-swimming under 20% (black) or 90% (red) MS, respectively. n = 112 (Ctrl 20% MS), n = 121 (Ctrl 20% MS), n = 118 (2 wpi 20% MS), n = 106 (2 wpi 90% MS), n = 119 (8 wpi 20% MS), n = 123 (8 wpi 90% MS) SBs. (J) Illustration of body curvature measurements made using eight markers placed on the long body axis at rest or maximum bending during a single SB. (K) Typical traces of body curvature at maximum bending during forced-swimming cycles at 20% (black) or 90% (red) MS for control and SCI animals. n = 20 (Ctrl 20% MS), n = 21 (Ctrl 20% MS), n = 25 (2 wpi 20% MS), n = 25 (2 wpi 90% MS), n = 18 (8 wpi 20% MS), n = 20 (8 wpi 90% MS) SBs. (L) Principal-component analysis of locomotor pattern during forced-swimming at 20% or 90% MS for SCI animals at 2 wpi (L2) and 8 wpi (L3), and in uninjured ones (L1). Each dot equals one SB from N = 10 (Ctrl), N = 10 (2 wpi), and N = 11 (8 wpi) fish. All data are presented as mean ± SD. ?p < 0.05, ??p < 0.01, ???p < 0.001, ????p < 0.0001, significant difference. See also Figure S3.
Image
Figure Caption
Acknowledgments
This image is the copyrighted work of the attributed author or publisher, and
ZFIN has permission only to display this image to its users.
Additional permissions should be obtained from the applicable author or publisher of the image.
Full text @ Cell Rep.

