
Fig. 2
- ID
- ZDB-FIG-221222-9
- Publication
- Chen et al., 2021 - Acute brain vascular regeneration occurs via lymphatic transdifferentiation
- Other Figures
- All Figure Page
- Back to All Figure Page
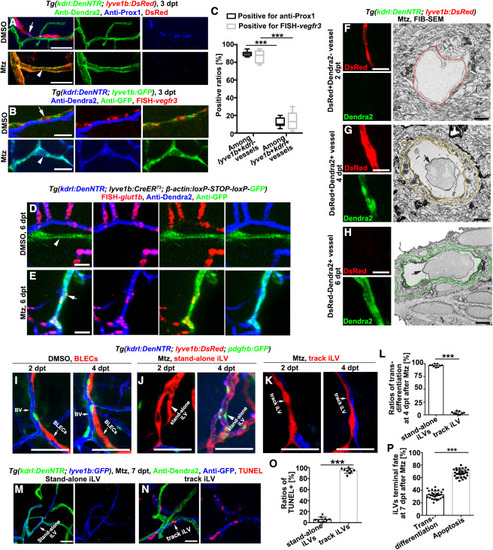
Figure 2. The transdifferentiating iLVs switch molecular and structural identities and are restricted to stand-alone iLVs (A?C) The lyve1b+kdrl? BLECs in the uninjured control (arrows), but not the transdifferentiating lyve1b+kdrl+ iLVs at 3 dpt after injury (arrowheads), were positive for anti-Prox1 (A) and fluorescence in situ hybridization (FISH)-vegfr3 (B). The statistics show the ratios of vessels positive for anti-Prox1 or FISH-vegfr3 among all the lyve1b+kdrl? vessels and all the lyve1b+kdrl+ vessels. (C) (n = 6 larvae; two-way ANOVA by Dunnett?s multiple comparisons test; ???, p < 0.0001). Scale bar, 20 ?m. (D and E) Positive control brain BVs in the uninjured larvae (D), the lineage-tracing system indicated that the vessels double positive for GFP and Dendra2 (E, arrow) and single positive for Dendra2 (D and E) expressed the blood-brain barrier marker glut1b, but vessels single positive for GFP (D, arrowhead) did not. Scale bar, 20 ?m. (F?H) Single FIB-SEM image planes (right row) indicate cross sections of the vessels shown in the left row. Note that the mural of the DsRed+Dendra2+ vessel (G) is similar to the DsRed-Dendra2+ BV (H) but much thicker than the DsRed+Dendra2? iLV (F). Color rings mark the inner and outer surfaces of murals. Arrows indicate blood cells. Scale bars, 20 and 1 ?m. (I?L) Live imaging shows BLECs (I), stand-alone iLVs (J, arrows), and track iLVs (K) at 2 and 4 dpt. Note that only the stand-alone iLVs express Dendra2 and recruit the GFP+ pericytes at 4 dpt (J, arrowheads). (L) The statistics show the ratios of transdifferentiation in the stand-alone iLVs and track iLVs at 4 dpt (n = 9 larvae; two-tailed unpaired t test; ???, p < 0.0001). Scale bar, 50 ?m. (M?P) The TUNEL signals in the stand-alone iLVs (M) and track iLVs (N) at 7 dpt. The statistics show the ratios of TUNEL+ cells in stand-alone iLVs and in track iLVs (O) (n = 9 larvae; ???, p < 0.0001), and the ratios of iLVs undergoing transdifferentiation (Dendra2+GFP+) or undergoing apoptosis (GFP+TUNEL+) among all the iLVs at 7 dpt (P) (n = 30 larvae; two-tailed unpaired t test; ???, p < 0.0001). Scale bar, 50 ?m. Data are represented as mean � SD. See also Figure S2. |
Reprinted from Developmental Cell, 56(22), Chen, J., Li, X., Ni, R., Chen, Q., Yang, Q., He, J., Luo, L., Acute brain vascular regeneration occurs via lymphatic transdifferentiation, 3115-3127.e6, Copyright (2021) with permission from Elsevier. Full text @ Dev. Cell