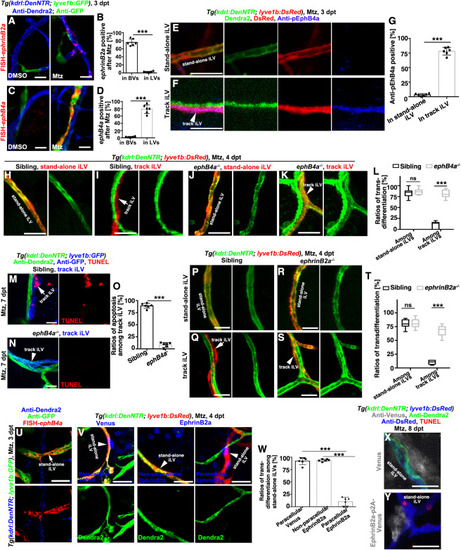
Fig. 3
- ID
- ZDB-FIG-221222-10
- Publication
- Chen et al., 2021 - Acute brain vascular regeneration occurs via lymphatic transdifferentiation
- Other Figures
- All Figure Page
- Back to All Figure Page
|
Figure 3. EphrinB2a/EphB4a are necessary and sufficient to inhibit the iLV-to-BV transdifferentiation (A?D) In contrast to their absence in the brain of uninjured control, ephrinB2a and ephB4a were, respectively, activated in the Dendra2+GFP? BVs and Dendra2?GFP+LVs after Mtz treatment (A and C). The statistics show ephrinB2a and ephB4a expression in the vessels, respectively (B and D) (n = 6 larvae; two-tailed unpaired t test; ???, p < 0.0001). (E?G) In contrast to the stand-alone iLV (E), expression of the tyrosine-phosphorylated EphB4 (pEphB4) indicate the activation of EphB4a in the track iLVs of the injured brain (F). The statistics show the ratios of pEphB4-positive among stand-alone and track iLVs (G) (n = 6 larvae; two-tailed unpaired t test; ???, p < 0.0001). (H?L) After Mtz treatment, the stand-alone iLV (H) underwent transdifferentiation in siblings, but the track iLVs (I, arrow) did not. In the ephB4a mutant, both stand-alone (J) and track iLVs expressed Dendra2 (K, arrowhead). The statistics show the ratios of transdifferentiation among stand-alone iLVs and track iLVs in siblings and in the ephB4a mutant (L) (n = 7 larvae; two-way ANOVA by Sidak?s multiple comparisons test; ns, p = 0.7299; ???, p < 0.0001). See also Video S6. (M?O) After Mtz treatment, the track iLVs finally underwent apoptosis (M, arrow). In the ephB4a mutant, the track iLVs expressed Dendra2 and became TUNEL-negative (N, arrowhead). The statistics show the ratios of apoptosis among the track iLVs in sibling and in the ephb4a mutant (O) (n = 6 larvae; two-tailed unpaired t test; ???, p < 0.0001). (P?T) In contrast to siblings (Q, arrow), the track iLVs in the ephrinB2a mutant expressed Dendra2 (S, arrowhead), whereas the transdifferentiation of stand-alone iLVs remained unaffected (P and R). The statistics show the ratios of transdifferentiation among stand-alone iLVs and track iLVs in sibling and in the ephrinB2a mutant (T) (n = 7 larvae; two-way ANOVA by Sidak?s multiple comparisons test; ns, p = 0.9675; ???, p < 0.0001). (U?W) The ephB4a expressed in the stand-alone iLVs after Mtz treatment (U). The paracellularly expressed EphrinB2a, repressed the Dendra2 expression in the stand-alone iLVs (V), but the nonparacellular EphrinB2a or paracellular Venus did not. The statistics show the ratios of transdifferentiation in the subpopulations of stand-alone iLVs (W) (n = 6 larvae; two-tailed unpaired t test; ???, p < 0.0001). (X and Y) The paracellularly expressed EphrinB2a (Y) caused apoptosis of the stand-alone iLVs, but Venus (X) did not. Scale bar, 20 ?m. NS, not significant. Data are represented as mean ± SD. See also Figures S3, S4, S5, and S7. |
Reprinted from Developmental Cell, 56(22), Chen, J., Li, X., Ni, R., Chen, Q., Yang, Q., He, J., Luo, L., Acute brain vascular regeneration occurs via lymphatic transdifferentiation, 3115-3127.e6, Copyright (2021) with permission from Elsevier. Full text @ Dev. Cell

