
Fig 1
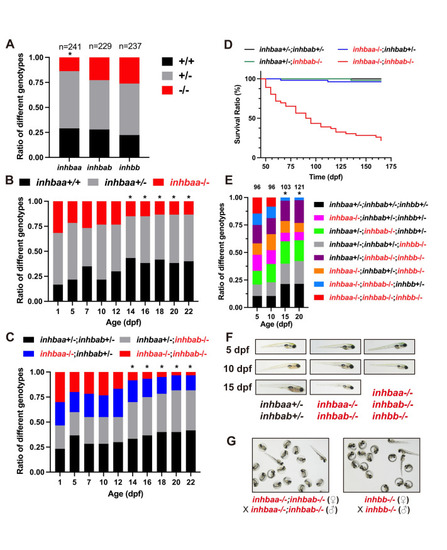
Analysis of survival ratios in activin ? subunit mutants.
(A) Ratios of different genotypes in the offspring of heterozygotes (+/- x +/-) at adult stage. (B) Ratios of different genotypes in the offspring of inhbaa+/- x inhbaa+/- from 1 to 22 dpf. Sixty fish were sampled at each time point (n = 60). (C) Ratios of different genotypes in the offspring of inhbaa+/-;inhbab-/- x inhbaa-/-;inhbab+/- from 1 to 22 dpf. Sixty fish were sampled at each time point (n = 60). (D) Kaplan?Meier plot for activin ?A single and double mutants (50 to 165 dpf; n = 46?54). (E) Ratios of different genotypes in the offspring of inhbaa+/-;inhbab-/-;inhbb+/- (?) x inhbaa-/-;inhbab+/-;inhbb-/- (?) from 5 to 20 dpf. The number of fish examined is shown on top of each column. (F) The larvae of control (inhbaa+/-;inhbab+/-), ?A double mutant (inhbaa-/-;inhbab-/-) and ?A/B triple mutant (inhbaa-/-;inhbab-/-;inhbb-/-) from 5 to 15 dpf. No triple mutant individuals could survive to 15 dpf. (G) Offspring of inhbaa-/-;inhbab-/- (?) x inhbaa-/-;inhbab-/- (?) and inhbb-/- (?) x inhbb-/- (?) at 72 hpf. The asterisk indicates significant deviation from expected ratios by Chi-square analysis (p<0.05). |