
Figure 4
- ID
- ZDB-FIG-221104-12
- Publication
- Zulueta-Coarasa et al., 2022 - Physical confinement promotes mesenchymal trans-differentiation of invading transformed cells in vivo
- Other Figures
- All Figure Page
- Back to All Figure Page
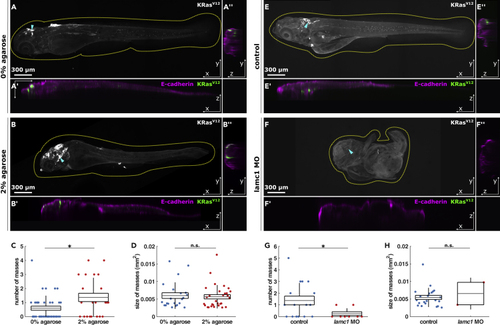
Experimental confinement promotes internal cell masses (A and B) Representative orthogonal views of 4.5 dpf embryos quantified in C & D expressing EGFP-KRasV12, stained for e-cadherin, and grown from 1 to 2 dpf in 0% (A) or 2% agarose (B), in XY (A, B), XZ (A′, B′) and YZ (A″, B″), with dotted lines outlining embryos and arrowheads the coordinates of XZ orthogonal sections. Scale bars, 300 μm. (C) Number of cell masses per embryo in 0% (n = 37) or 2% agarose (n = 22) embryos. (D) Cell mass areas from embryos grown in 0% (n = 22) or 2% agarose (n = 30). 4.5 dpf control (E) and (G) Number of cell masses per embryo in controls (n = 16) or (H) Area of cell masses in control (n = 22) or |