IMAGE

Figure 4

ID
ZDB-IMAGE-221104-13
Source
Figures for Zulueta-Coarasa et al., 2022
Image
Figure Caption

Figure 4

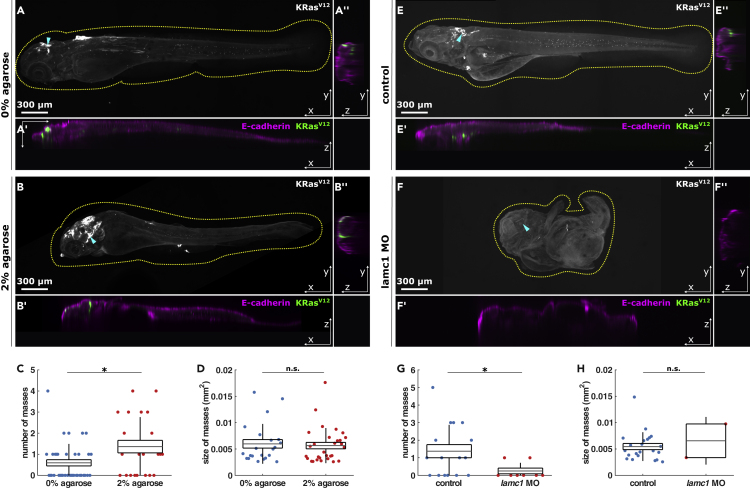
Experimental confinement promotes internal cell masses

(A and B) Representative orthogonal views of 4.5 dpf embryos quantified in C & D expressing EGFP-KRasV12, stained for e-cadherin, and grown from 1 to 2 dpf in 0% (A) or 2% agarose (B), in XY (A, B), XZ (A′, B′) and YZ (A″, B″), with dotted lines outlining embryos and arrowheads the coordinates of XZ orthogonal sections. Scale bars, 300 μm.

(C) Number of cell masses per embryo in 0% (n = 37) or 2% agarose (n = 22) embryos.

(D) Cell mass areas from embryos grown in 0% (n = 22) or 2% agarose (n = 30). 4.5 dpf control (E) and lamc1 MO-injected (F) embryos expressing EGFP-KRasV12, as projections (E, F), XZ (E′, F′) and YZ sections (E″, F″). Yellow dotted lines outline embryos and arrowheads mark where orthogonal sections were taken. Scale bars, 300 μm.

(G) Number of cell masses per embryo in controls (n = 16) or lamc1 morphants (n = 8).

(H) Area of cell masses in control (n = 22) or lamc1 MO-injected embryos (n = 2). In C, D, G and H, error bars are the SD, box the SEM and gray lines show the mean. n.s., not significant, ∗p < 0.05.

Acknowledgments
This image is the copyrighted work of the attributed author or publisher, and ZFIN has permission only to display this image to its users. Additional permissions should be obtained from the applicable author or publisher of the image. Full text @ iScience