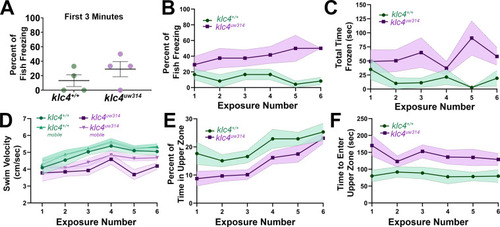
(A) Percentage of fish per experiment that froze during the first 3 min of a 10-min initial exposure to a novel tank. (B) Plot of the percentage of fish that froze during the course of six 10-min exposures to the same novel tank. (C) Plot of the average time spent frozen during the course of six 10-min exposures to the same novel tank. (D) Plot of the average total and mobile-only swim velocities of fish during each of six 10-min exposures to the same novel tank. Mobile-only velocity excludes periods of time the fish spent at a velocity of 0 cm/s (frozen). (E) Plot of the percentage of time that fish spent in the upper zone of the tank during the course of six 10-min exposures to the same novel tank. (E) Plot of the average time it took for a fish to first enter the upper zone of the tank during the course of six 10-min exposures to the same novel tank. For all data, N=4 groups per genotype, 23 total fish per genotype. Error bars = SEM. For figures D-F, videos that could not be automatically tracked were omitted (for WT, 6/138, for klc4uw314, 4/138).