Fig. 5
- ID
- ZDB-FIG-220926-13
- Publication
- Zoodsma et al., 2022 - Disruption of grin2B, an ASD-associated gene, produces social deficits in zebrafish
- Other Figures
- All Figure Page
- Back to All Figure Page
|
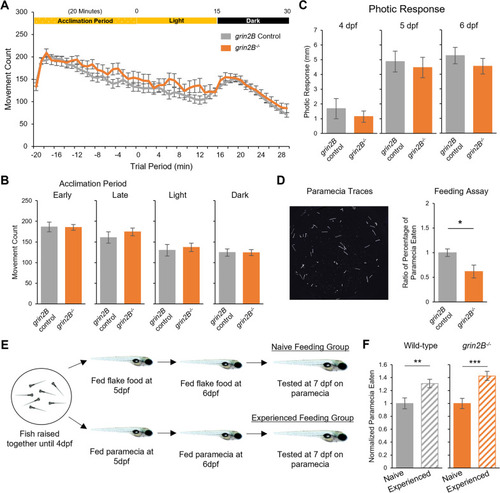
Zebrafish larvae lacking grin2B have wild-type spontaneous and photic-evoked swim behaviors and show the capacity to learn prey capture. A Spontaneous and photic-evoked larval swim behavior assay. Zebrafish larvae at 6 dpf acclimate to a behavior chamber for 20 min in the light and then are recorded for 15 min of spontaneous movement; after the removal of illumination, 15 min of behavior is measured in the dark. Line graph showing average movement count for a grin2B control (n = 70) and the grin2B?/? fish (n = 30). Both control and mutant larvae exhibited the stereotypical visual motor response (VMR). B Bar graphs (mean ▒ SEM) of average movement count in each time period of the spontaneous and photic-evoked behavior outlined in (A). No differences were seen in any time period. C Zebrafish respond with a stereotyped startle response to the removal of illumination. Bar graphs showing the average distance traveled for a grin2B control (n = 19, 22, 22) and the grin2B?/? fish (n = 27, 31, 31) for 4, 5, and 6 dpf, respectively, in the 1 s time period immediately following the removal of illumination. No difference was seen in the average response between groups at 4, 5, or 6 dpf. D Representative traces of paramecium movement used in feeding assay. Traces generated by analyzing 2.5 s of paramecia movement. Proportion of paramecia eaten over the trial period (mean ▒ SEM) normalized to control for: grin2B Control (n = 51) or grin2B?/? (n = 20) fish at 7 dpf (*p = 0.011, t test). E Schematic of larval prey capture learning assay. F Proportion of paramecia eaten (mean ▒ SEM) in wild-type (left) (n = 35, 35. p = 0.005**, t test) and grin2B?/? (n = 35, 32. p = 1.4e?4***, t test) for na´ve (solid bars) and experienced (striped bars) fish, respectively. Proportion of paramecia eaten is normalized to the na´ve feeding group |
| Fish: | |
|---|---|
| Observed In: | |
| Stage Range: | Day 4 to Day 6 |

