
Fig. 8
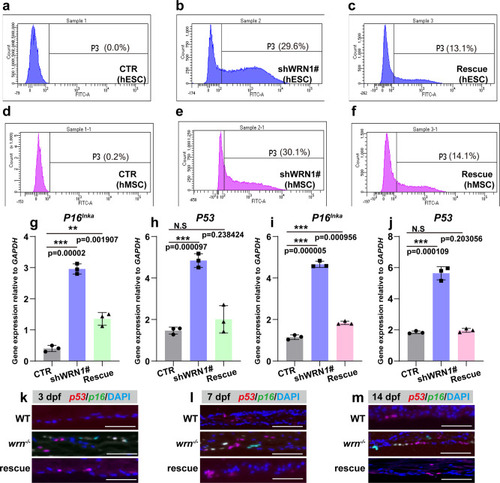
SHOX/shox prevents chondrocyte senescence in WS models.
a?f Representative flow cytometry plots of three independent biological experiments for senescent analysis among CTR, shWRN1#, and rescue groups in hESC (a?c) and hMSC (d?f). g?j qRT-PCR measurement of P53 and P16Ink4a in CTR, shWRN1#, and rescue groups in hESC (g?h) and hMSC (i?j) on day 14. N = 3 independent biological experiments. k?m Representative FISH analysis of 3 independent experiments of p53 and p16 in WT, wrn?/? mutant, and rescue groups on 3 dpf, 7 dpf, and 14 dpf. Scale bar = 50 �m. Data are presented as the mean � S.D. Statistical analysis was performed using two-tailed unpaired Student?s t-test. *P < 0.05, **P < 0.01, ***P < 0.001. |
| Genes: | |
|---|---|
| Fish: | |
| Anatomical Term: | |
| Stage Range: | Protruding-mouth to Days 14-20 |
| Fish: | |
|---|---|
| Observed In: | |
| Stage Range: | Protruding-mouth to Days 14-20 |