
Fig. 3
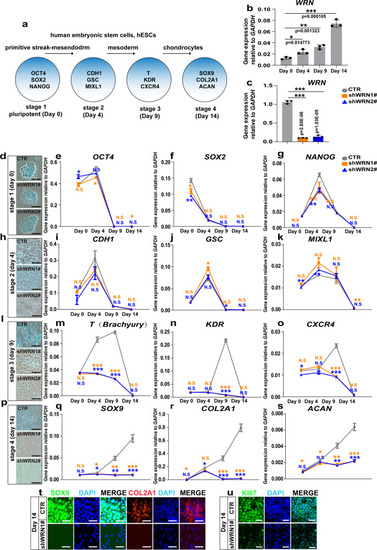
WRN deficiency impairs cartilage development in vitro.
a Illustration of hESCs differentiation model. b qRT-PCR measurement of WRN expression profile during chondrogenesis in hESCs. N = 3 independent biological experiments. c. qRT-PCR measurement of WRN-KD efficiency. N = 3 independent biological experiments. d, h, l, p Representative alcian blue staining of 3 independent experiments to examine the formation of chondrocyte on day 0 (d), day 4 (h), day 9 (l), and day 14 (p) between CTR and two KD-WRN groups. Scale bar = 20 �m. e?g qRT-PCR measurement of genes (NANOG, OCT4, and SOX2) related to hESC pluripotency stage. N = 3 independent biological experiments. i?k qRT-PCR measurement of genes (MIXL1, GSC, and CDH1) related to the primitive streak-mesendodermal stage. N = 3 independent biological experiments. m?o. qRT-PCR measurement of genes (T, KDR, and CXCR4) related to the mesodermal stage. N = 3 independent biological experiments. q?s qRT-PCR measurement of genes (SOX9, COL2A1, and ACAN) related to chondrocytes. N = 3 independent biological experiments. t Representative immunofluorescent staining of 3 independent experiments between the CTR and KD-WRN groups on day 14 in hESCs. SOX9 and COL2A1 were examined. Scale bar = 50 �m. u Representative images of immunofluorescent staining of 3 independent experiments between the CTR and KD-WRN groups on day 14 in hESCs. Ki67 was examined. Scale bar = 20 �m. Data are presented as the mean � S.D. Statistical analysis was performed using two-tailed unpaired Student?s t-test. *P < 0.05, **P < 0.01, ***P < 0.001. |