
Fig. 1
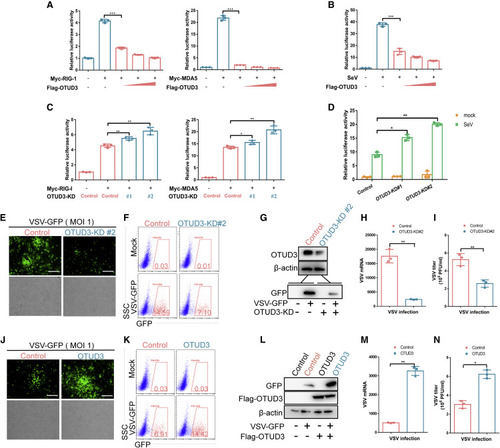
Figure 1. OTUD3 inhibits viral RNA-triggered signaling (A) Luciferase activity of IFN-? promoter reporter (300 ng) in HEK293T cells transfected with increased amounts of FLAG-OTUD3 plasmid (0, 200, 400, and 600 ng; wedge) together with either RIG-I (left) or MDA5 (right), respectively. (B) Luciferase activity of IFN-? promoter reporter (300 ng) in HEK293T cells transfected with increased amounts of FLAG-OTUD3 plasmid (0, 200, 400, and 600ng; wedge) followed by without/with SeV infection (MOI = 0.1). (C) Luciferase activity of IFN-? promoter reporter in OTUD3 knockdown HEK293T cells (OTUD3-KD #1 and OTUD3-KD #2) transfected with either RIG-I (left) or MDA5 (right) respectively. (D) Luciferase activity of IFN-? promoter reporter in OTUD3 knockdown HEK293T cells (OTUD3-KD #1 and OTUD3-KD #2) without (mock) or with SeV infection (MOI = 0.1). (E) Microscopy imaging of the replication of VSV-GFP in the control and OTUD3 knockdown (OTUD3-KD #2) HEK293T cells followed by VSV-GFP (1 MOI) challenge for 24 h. Scale bar, 200 ?m. (F) Flow cytometry analysis of the replication of VSV-GFP in the control and OTUD3 knockdown (OTUD3-KD #2) HEK293T cells followed by VSV-GFP (MOI = 1) challenge for 24 h. Scale bar, 200 ?m. (G) Immunoblotting for OTUD3 expression in the control and OTUD3 knockdown (OTUD3-KD #2) HEK293T cells, and the efficiency of VSV-GFP virus infection. (H and I) Quantitative real-time PCR (qRT-PCR) analysis of VSV mRNA and the measurement of virus titer in the control and OTUD3 knockdown (OTUD3-KD #2) HEK293T cells followed by VSV-GFP challenge for 24 h. (J) Microscopy imaging of the replication of VSV-GFP in the control and OTUD3-overexpressed HEK293T cells followed by VSV-GFP (MOI = 1) challenge for 24 h. (K) Flow cytometry analysis of the replication of VSV-GFP in the control and OTUD3-overexpressed HEK293T cells followed by VSV-GFP (MOI = 1) challenge for 24 h. (L) Immunoblotting for OTUD3 expression in the control and OTUD3-overexpressed HEK293T cells, and the efficiency of VSV-GFP virus infection. (M and N) qRT-PCR analysis of VSV mRNA and the measurement of virus titer in the control and OTUD3 overexpressed HEK293T cells followed by VSV-GFP challenge for 24 h. ?p < 0.05, ??p < 0.01, and ???p < 0.001, using unpaired Student?s t test (A?D; H, I, M, and N). Data based on one representative experiment performed in three biological replicates from at least three independent experiments (mean � SD) or representative data (E?G and J?L). |