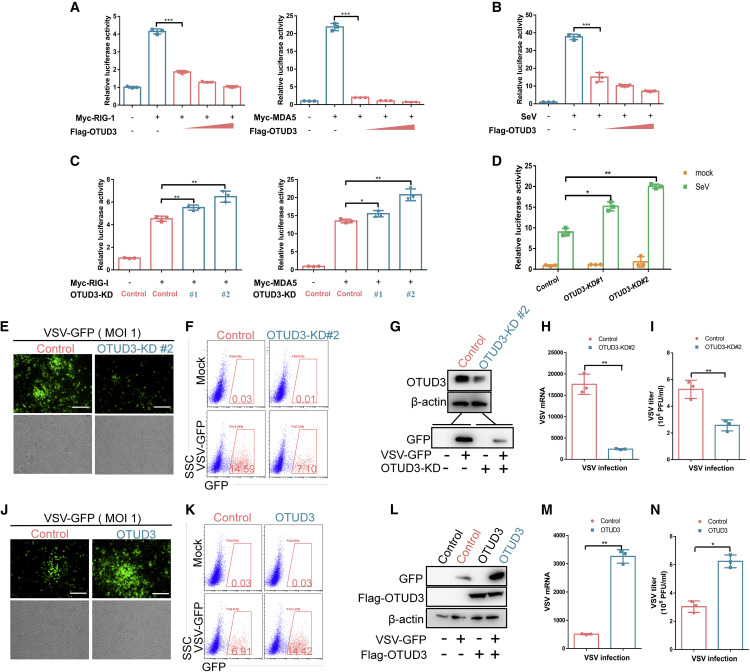
Fig. 1 Figure 1. OTUD3 inhibits viral RNA-triggered signaling (A) Luciferase activity of IFN-? promoter reporter (300 ng) in HEK293T cells transfected with increased amounts of FLAG-OTUD3 plasmid (0, 200, 400, and 600 ng; wedge) together with either RIG-I (left) or MDA5 (right), respectively. (B) Luciferase activity of IFN-? promoter reporter (300 ng) in HEK293T cells transfected with increased amounts of FLAG-OTUD3 plasmid (0, 200, 400, and 600ng; wedge) followed by without/with SeV infection (MOI = 0.1). (C) Luciferase activity of IFN-? promoter reporter in OTUD3 knockdown HEK293T cells (OTUD3-KD #1 and OTUD3-KD #2) transfected with either RIG-I (left) or MDA5 (right) respectively. (D) Luciferase activity of IFN-? promoter reporter in OTUD3 knockdown HEK293T cells (OTUD3-KD #1 and OTUD3-KD #2) without (mock) or with SeV infection (MOI = 0.1). (E) Microscopy imaging of the replication of VSV-GFP in the control and OTUD3 knockdown (OTUD3-KD #2) HEK293T cells followed by VSV-GFP (1 MOI) challenge for 24 h. Scale bar, 200 ?m. (F) Flow cytometry analysis of the replication of VSV-GFP in the control and OTUD3 knockdown (OTUD3-KD #2) HEK293T cells followed by VSV-GFP (MOI = 1) challenge for 24 h. Scale bar, 200 ?m. (G) Immunoblotting for OTUD3 expression in the control and OTUD3 knockdown (OTUD3-KD #2) HEK293T cells, and the efficiency of VSV-GFP virus infection. (H and I) Quantitative real-time PCR (qRT-PCR) analysis of VSV mRNA and the measurement of virus titer in the control and OTUD3 knockdown (OTUD3-KD #2) HEK293T cells followed by VSV-GFP challenge for 24 h. (J) Microscopy imaging of the replication of VSV-GFP in the control and OTUD3-overexpressed HEK293T cells followed by VSV-GFP (MOI = 1) challenge for 24 h. (K) Flow cytometry analysis of the replication of VSV-GFP in the control and OTUD3-overexpressed HEK293T cells followed by VSV-GFP (MOI = 1) challenge for 24 h. (L) Immunoblotting for OTUD3 expression in the control and OTUD3-overexpressed HEK293T cells, and the efficiency of VSV-GFP virus infection. (M and N) qRT-PCR analysis of VSV mRNA and the measurement of virus titer in the control and OTUD3 overexpressed HEK293T cells followed by VSV-GFP challenge for 24 h. ?p < 0.05, ??p < 0.01, and ???p < 0.001, using unpaired Student?s t test (A?D; H, I, M, and N). Data based on one representative experiment performed in three biological replicates from at least three independent experiments (mean ± SD) or representative data (E?G and J?L).
Image
Figure Caption
Acknowledgments
This image is the copyrighted work of the attributed author or publisher, and
ZFIN has permission only to display this image to its users.
Additional permissions should be obtained from the applicable author or publisher of the image.
Full text @ Cell Rep.

