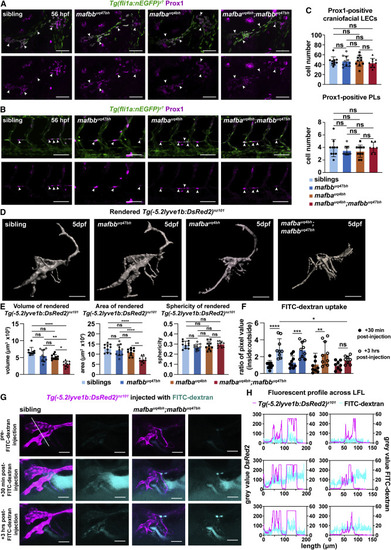
Figure 2. mafba and mafbb regulate lymphatic-vessel morphology and function but not specification (A and B) Prox1-positive LECs (magenta) (arrows) co-labeled with Tg(fli1a:nEGFP) (green) at 56 hpf in (A) face and (B) trunk in siblings and mafbb, mafba, and double mutants. Scale bars, 50 ?m. (C) LEC progenitors quantification of Prox1 and Tg(Fli1a:nEGFP) double-positive cells. Embryos per genotype; n = 10; Kruskal-Wallis test: ns p ? 0.5331. (D) Surface rendering of Tg(-5.2lyve1b:DsRed2) for siblings and mafbb, mafba, and double mutants from confocal z stack images at 5 dpf. Scale bars, 100 ?m. (E) Quantification of rendered surfaces. Embryos per genotype; n = 10. (left) Volume Kruskal-Wallis: ????p < 0.0001 for siblings versus double mutants; ??p = 0.0079 for mafbb versus double mutants; ?p = 0.045 for mafba versus double mutants; ns for all other comparisons p ? 0.244. (Center) Area. One-way ANOVA: ????p < 0.0001 for siblings or mafbb versus double mutants; ??p < 0.0025 for mafba versus double mutants; ns for all other comparisons p ? 0.186. (Right) Sphericity. One-way ANOVA: ns p ? 0.234. (F) Uptake of FITC-dextran presented as a ratio of the average pixel value of z slices inside and outside the lymphatics. siblings n = 9, mafbb n = 9, mafba n = 9, and double mutants n = 8. Two-way ANOVA: from +30 min to +3 h post-FITC-dextran injection uptake is ????p < 0.0001 for siblings ???p = 0.0003 for mafbb, ??p = 0.0014 for mafba, and ns p = 0.2415 for double mutants. +3 h post-FITC-dextran injection FITC-dextran uptake: ?p = 0.0265 for siblings versus double mutants. Other interactions: ns p ? 0.0626. (G) Confocal projection of LFL with FITC-dextran (cyan) and Tg(-5.2lyve1b:DsRed2) (magenta) in siblings and double mutants at 5 dpf. Images of pre-injection, +30 min and +3 h post-injection. Scale bars, 100 ?m. White line: trajectory for graphs in (H). (H) Fluorescence profile of Tg(-5.2lyve1b:DsRed2) (magenta) and FITC-dextran (cyan) intersecting the lymphatics from (G). ns, non-significant; stars are significant; error bars are mean �SD. See also Figure S2 and Videos S1, S2, S3, and S4.
|
