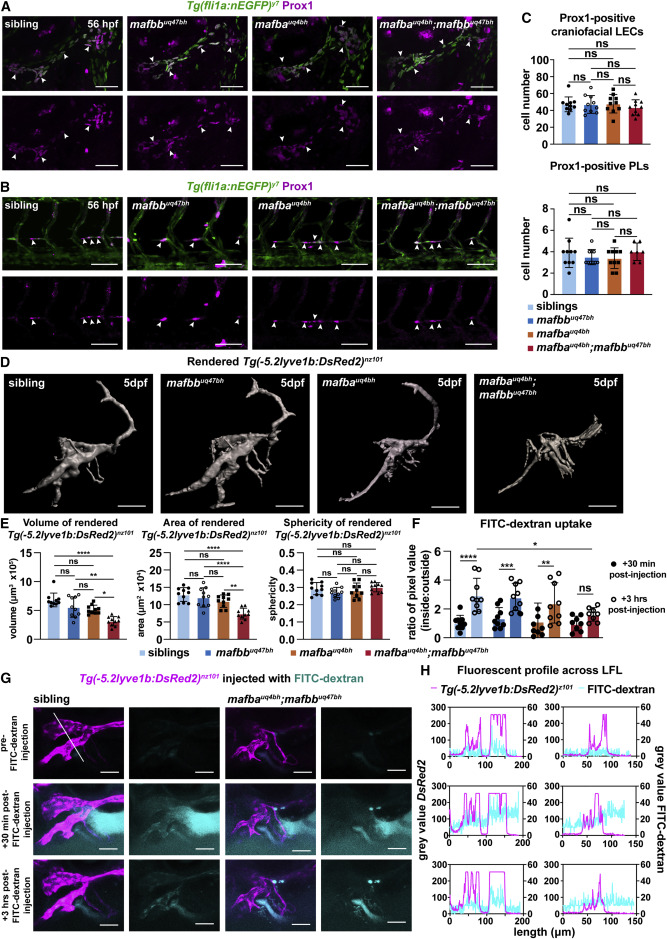
Fig. 2 Figure 2. mafba and mafbb regulate lymphatic-vessel morphology and function but not specification (A and B) Prox1-positive LECs (magenta) (arrows) co-labeled with Tg(fli1a:nEGFP) (green) at 56 hpf in (A) face and (B) trunk in siblings and mafbb, mafba, and double mutants. Scale bars, 50 ?m. (C) LEC progenitors quantification of Prox1 and Tg(Fli1a:nEGFP) double-positive cells. Embryos per genotype; n = 10; Kruskal-Wallis test: ns p ? 0.5331. (D) Surface rendering of Tg(-5.2lyve1b:DsRed2) for siblings and mafbb, mafba, and double mutants from confocal z stack images at 5 dpf. Scale bars, 100 ?m. (E) Quantification of rendered surfaces. Embryos per genotype; n = 10. (left) Volume Kruskal-Wallis: ????p < 0.0001 for siblings versus double mutants; ??p = 0.0079 for mafbb versus double mutants; ?p = 0.045 for mafba versus double mutants; ns for all other comparisons p ? 0.244. (Center) Area. One-way ANOVA: ????p < 0.0001 for siblings or mafbb versus double mutants; ??p < 0.0025 for mafba versus double mutants; ns for all other comparisons p ? 0.186. (Right) Sphericity. One-way ANOVA: ns p ? 0.234. (F) Uptake of FITC-dextran presented as a ratio of the average pixel value of z slices inside and outside the lymphatics. siblings n = 9, mafbb n = 9, mafba n = 9, and double mutants n = 8. Two-way ANOVA: from +30 min to +3 h post-FITC-dextran injection uptake is ????p < 0.0001 for siblings ???p = 0.0003 for mafbb, ??p = 0.0014 for mafba, and ns p = 0.2415 for double mutants. +3 h post-FITC-dextran injection FITC-dextran uptake: ?p = 0.0265 for siblings versus double mutants. Other interactions: ns p ? 0.0626. (G) Confocal projection of LFL with FITC-dextran (cyan) and Tg(-5.2lyve1b:DsRed2) (magenta) in siblings and double mutants at 5 dpf. Images of pre-injection, +30 min and +3 h post-injection. Scale bars, 100 ?m. White line: trajectory for graphs in (H). (H) Fluorescence profile of Tg(-5.2lyve1b:DsRed2) (magenta) and FITC-dextran (cyan) intersecting the lymphatics from (G). ns, non-significant; stars are significant; error bars are mean ąSD. See also Figure S2 and Videos S1, S2, S3, and S4.
Image
Figure Caption
Figure Data
Acknowledgments
This image is the copyrighted work of the attributed author or publisher, and
ZFIN has permission only to display this image to its users.
Additional permissions should be obtained from the applicable author or publisher of the image.
Full text @ Cell Rep.

