
Fig. 4
- ID
- ZDB-FIG-220623-22
- Publication
- Wilcock et al., 2022 - Oxidative stress from DGAT1 oncoprotein inhibition in melanoma suppresses tumor growth when ROS defenses are also breached
- Other Figures
- All Figure Page
- Back to All Figure Page
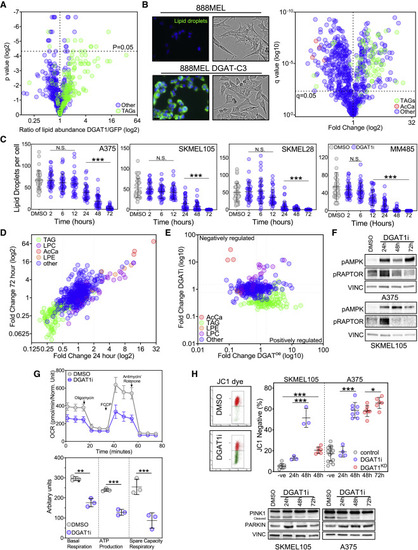
Figure 4. DGAT1-formed lipid droplets act as caretakers of mitochondrial health (A) Lipidomic profiling using UHPLC-MS of NRASG12D-positive EGFP-expressing (n = 6) and NRASG12D-positive Dgat1a-over-expressing (n = 6) tumors showing the ratio of individual lipid species annotated by MS/MS. (B) Representative images of 888MEL and Clone 3 cells stained with BODIPY (left; scale bar, 10 ?m). Brightfield images of 888MEL parental cells and Clone 3 DGAT1-over-expressing cells (middle). UHPLC-lipidomic analysis of 888MEL parental and Clone 3 DGAT1-over-expressing cells. Fold change relative to 888MEL parental cells (right) (all conditions n = 3). TAG, triacylglycerides; AcCa, acylcarnitine. (C) Number of lipid droplets per cell visualized using BODIPY staining following AZD3988 (DGAT1i) treatment (mean � SD, n > 30). (D) UHPLC-lipidomic analysis of SKMEL105 cells following A922500 treatment. Fold change relative to DMSO (all conditions n = 3). TAG, triacylglycerides; LPC, lysophosphatidycholine; LPE, lysophosphatidylethanolamine. (E) Lipid species fold changes in SKMEL105 following 72-h A922500 treatment plotted versus lipid species fold changes observed in Clone 3 cells. (F) Protein expression of phospho-AMPK and phospho-RAPTOR following A922500 (DGAT1i) treatment. (G) Oxygen consumption rate in A375 cells following 48-h A922500 treatment (top). Basal respiration, ATP production, and spare respiratory capacity were calculated (bottom) (mean � SD, n = 3). (H) Staining with JC-1 dye following A922500 treatment or following transfection with DGAT1 targeting siRNA. The percentage of cells that lost red aggregates was calculated by using 1 ?M CCP as a positive control and comparing this with untreated cells to create two populations of cells for flow cytometry analysis (top; mean � SD, n > 3). Protein expression of PINK1 and PARKIN following A922500 treatment (bottom). (C, G, and H) For significance: ?p < 0.05, ??p < 0.01, and ???p < 0.001. |