
Fig. 3
- ID
- ZDB-FIG-220623-21
- Publication
- Wilcock et al., 2022 - Oxidative stress from DGAT1 oncoprotein inhibition in melanoma suppresses tumor growth when ROS defenses are also breached
- Other Figures
- All Figure Page
- Back to All Figure Page
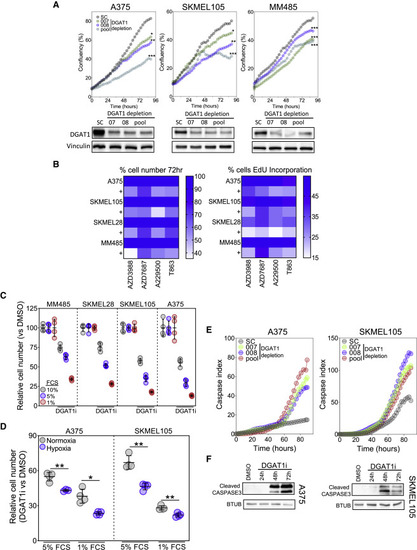
igure 3. DGAT1 antagonism decreases melanoma cell proliferation and survival (A) Confluence of cell lines transfected with DGAT1 targeting (007, 008, pool) or scrambled (sc) siRNAs (mean, n = 3, top). Corresponding protein expression of DGAT1 (bottom). (B) Left: relative cell number (mean, n > 3) in indicated cell lines determined by crystal violet following 72-h DGAT1 inhibitor treatment (50 ?M AZD3988, 30 ?M A922500, 50 ?M AZD7687, or 70 ?M T863). Right: percentage of cells in S-phase by using EdU incorporation following 24-h DGAT1 inhibitor treatment (mean, n > 3). (C) Relative cell number determined by crystal violet staining following 72-h A922500 treatment with cells grown in varying concentrations of fetal calf serum (FCS; mean � SD, n > 3). (D) Relative cell number determined by crystal violet staining following 48-h A922500 treatment under normoxic or hypoxic conditions (1% O2) with cells grown in varying concentrations of FCS (relative to DMSO control for each condition; mean � SD, n > 3). (E) Cleaved caspase index in indicated cell lines following transfection with either a DGAT1-targeting siRNA (007, 008, pool) or a sc control (mean, n = 3). (F) Protein expression of cleaved caspase-3 following treatment with/without A922500 for 24?72 h. (A) and (D) For significance: ?p < 0.05, ??p < 0.01, and ???p < 0.001. |