|
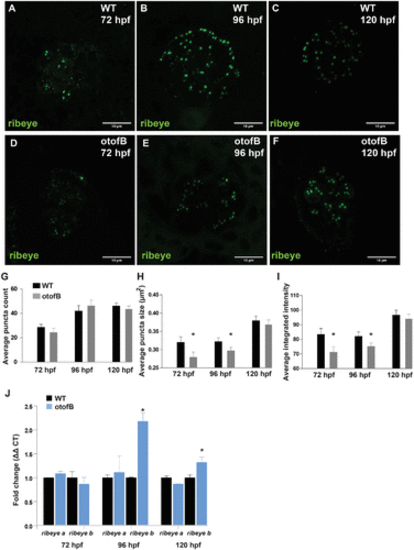
The otofB mutation results in reduced expression of Ribeye in neuromasts. (A?C) Representative confocal images of 72 hpf (A), 96 hpf (B), and 120 hpf (C) wild-type neuromasts stained for Ribeye. (D?F) Representative confocal images of 72 hpf (D), hpf 96 (E), and 120 hpf (F) mutant neuromasts stained for Ribeye. (G) Average puncta count in Ribeye-stained wild-type and otofB neuromasts (t test, p < 0.001). N = 4 WT and 6 mutant larvae, 4 neuromasts per larvae for both WT and mutant. (H) Average Ribeye puncta sizes in ?m2 for wild-type and otofB mutant neuromasts. (I) Average integrated intensity of Ribeye puncta for wild-type and otofB mutant neuromasts. (J) Quantification of Ribeye a and Ribeye b mRNA transcript expression at 72, 96, and 120 hpf in WT and otofB mutant larvae (t test, p < 0.001). N = 4 for both wild type and mutant. Scale bars = 5 �m.
|