
Fig. 6
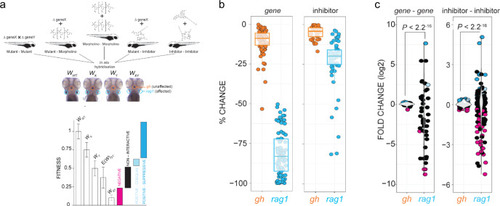
a Schematic of the types of experiments underlying the interaction network. The integrated interaction screen consists of mutant?mutant, mutant?morpholino, morpholino?morpholino, mutant?inhibitor, and inhibitor?inhibitor interactions, where the numbers of T cells as determined by rag1 gene expression relative to growth hormone (gh)-expressing somatotrophic epithelial cells is normalized to wild-type levels (WWT; fitness). Single mutant (Wx, Wy) and double mutant fitness (Wxy) values were determined by normalization of their rag1/gh ratios to wild-type rag1/gh ratios. The expected double mutant fitness E(Wxy) is the product of single mutant fitness values (Wx � Wy). A non-interactive line is assigned to an observed double-mutant fitness value that is within the propagated error of expected double-mutant fitness. Negative interaction is called when an observed double-mutant fitness is significantly less than the expected double-mutant fitness minus the propagated error. Positive?coequal interaction is called when an observed double-mutant fitness is significantly greater than the expected double-mutant fitness plus the propagated error, but equivalent to the least fit single mutant. Positive?suppressive interaction is called when an observed double-mutant fitness is significantly greater than the expected double-mutant fitness plus propagated error and greater than the least fit single mutant. b Effect of gene mutations (mutants and morphants) and inhibitor treatments on two different tissues, pituitary gland (as determined by gh expression) and T cell (as determined by rag1 expression). The changes in expression levels in percent relative to genetically wild-type (panel designated gene) or untreated controls (panel designated inhibitor) are given for rag1 and gh hybridization signals (cf., Figs. 4 and 5). For both types of analyses, the differences between gh and rag1 expression levels are significant at P < 0.001 (two-tailed Student�s t-test). c Effect of gene?gene genetic interactions (mutant?mutant) and inhibitor genetic interactions (inhibitor?inhibitor) on two different tissues, T cell (rag1) and pituitary gland (gh). Relative log2-fold changes between observed (Wxy) and expected double mutant fitness E(Wxy) values are given for T cells and growth hormone-producing somatotropic cells. Colours represent the interaction types (black, non-interactive; magenta, negative; light-blue, positive-coequal; dark blue, positive-suppressive). P values were determined by two-tailed Student�s t-test. Statistical tests for homogeneity of variances were performed using Bartlett?s test. |