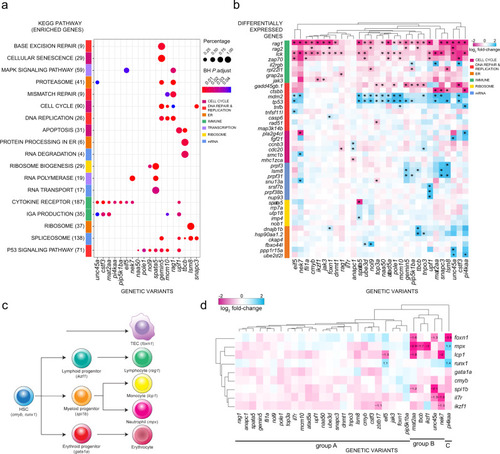
Fig. 2
|
a Transcriptome analysis and ClusterProfiler pathway enrichment of top 1500 differentially expressed genes (DEG) (FDR ? 0.05) from each genetic variant. Genetic variants are shown in columns and enriched KEGG pathways in rows, with brackets indicating the number of enriched genes from each pathway; only 18 of 30 genetic variants exhibited significant deregulation of KEGG pathways. Row side colours identify pathways in similar biological functional categories. Point sizes represent the percentages of genes enriched from each pathway for each genetic variant; point colours specify Benjamini?Hochberg (BH)-adjusted P values. b Top DEG in genetic variants. Genetic variants are shown in columns and DEG in rows, grouped by biological functional categories. The following KEGG identifiers were included. T cell development (T cell receptor?mmu04660, primary immunodeficiency?mmu05340, Notch signaling?mmu04330), DNA synthesis (DNA replication?mmu03030, MMR?dre03430, BER?dre03410, HR?dre03440, p53 signaling?dre04115), cell cycle (apoptosis?dre04210, cell cycle?dre04110, cellular senescence?dre04218), mRNA processing (spliceosome?dre03040, mRNA surveillance?dre03015, nonsense-mediated decay?dre03015), ribosome function (ribosome biogenesis?dre03008, ribosome?dre03010) and endoplasmic reticulum (ER) (protein processing in ER?dre04141, proteasome?dre03015). Asterisks define the top six DEG (|log2 fold change| ? 0.5) per genetic variant. c Schematic of haematopoietic differentiation pathways. Each cell type is marked with a signature gene(s), whose expression levels are taken as indicative of their presence. Note that the thymic epithelium represents a separate lineage and originates from pharyngeal endoderm. At the time of analysis (5 d.p.f.), B cell development has not yet started, so that rag1 expression levels are indicative of developing T cells. d Expression levels of signature genes (excluding rag1; see Fig. 2b, and text) as determined by RNA-seq at 5 d.p.f. for all genetic variants. The log2 fold changes are indicated. Some of the gene expression changes detected in the RNA-seq analysis were confirmed by RNA in situ hybridization at different stages of development (see Supplementary Fig. 3). |

