
Fig. 9
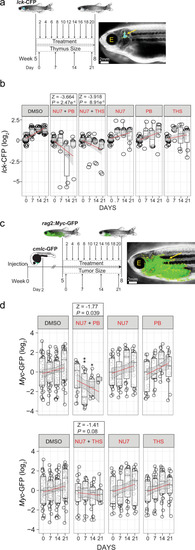
a Treatment schedule of adolescent lck-CFP zebrafish (5 weeks of age) with the indicated inhibitor combinations. The thymus size relative to fish size was measured weekly. Representative dark field image of a zebrafish with the lck-CFP fluorescent signal overlay (yellow arrow and outline). The position of the eye is labelled for orientation (E). b Thymus size during combination treatment of adolescent lck-CFP zebrafish. The sizes of thymi are expressed as log2-fold changes relative to the sizes at day 0 of treatment. The significance of differences between day 0 and days following treatment was determined by two-way ANOVA, for repeated measurements with Bonferroni post-test. A z statistic was used to compare regression coefficients between treated and untreated groups. See source data file for Fig. 9b in Supplementary Data 2. c Treatment schedule of adolescent rag2:Myc-GFP?injected zebrafish (5 weeks of age) with inhibitor combinations, following the onset of T-ALL. Rag2:Myc-GFP and cmlc-GFP containing plasmids were co-injected into wild-type fish at the one-cell stage and sorted for heart expression of the cmlc-GFP reporter at 2 d.p.f. as an indicator of successful transgenesis. Transgenic fish were grown until the age of 5 weeks and then sorted for onset of T-ALL using rag2:Myc-GFP. Tumor sizes relative to fish size were measured weekly. Representative dark field image of a 5 week old zebrafish with rag2:Myc-GFP fluorescent signal overlay (yellow arrow and outline). d T-ALL tumor sizes following combination inhibitor treatment of adolescent rag2:Myc-GFP. Tumor sizes are expressed as log2-fold changes relative to day 0 of treatment. *P < 0.05; **P < 0.01. See source data file for Fig. 9d in Supplementary Data 2. |