FIGURE

Fig. 3

ID
ZDB-FIG-210712-19
Publication
Buono et al., 2021 - Analysis of gene network bifurcation during optic cup morphogenesis in zebrafish
Other Figures
All Figure Page
Back to All Figure Page
Fig. 3

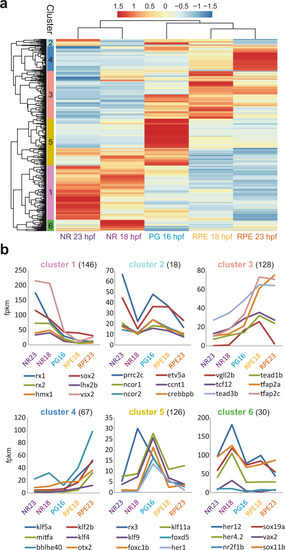
Hierarchical clustering of TFs gene expression variations during optic cup development.

a Hierarchical clustering output shows TFs expression trends in the distinct domains and stages. Gene expression values, normalized by row, are indicated with a red to blue graded color. Note that most clusters comprise a particular domain and developmental stage. b Relative transcript level changes for significant TFs (n) within each cluster.

Expression Data

Expression Detail
Antibody Labeling
Phenotype Data

Phenotype Detail
Acknowledgments
This image is the copyrighted work of the attributed author or publisher, and ZFIN has permission only to display this image to its users. Additional permissions should be obtained from the applicable author or publisher of the image. Full text @ Nat. Commun.