|
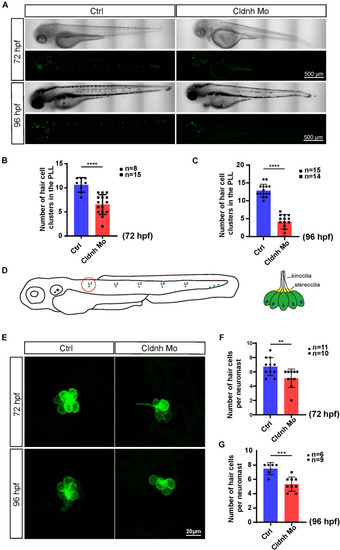
Claudin h knockdown decreased hair cell in the posterior lateral line of zebrafish. (A) The imaging analysis of control and claudin h morphants at 72 and 96 hpf in bright field and fluorescent field. Scale bar = 500 μm. (B,C) Quantification of the number of hair cell clusters in the posterior lateral line of control and claudin h morphants at 72 and 96 hpf. (D) The schematic for different hair cell clusters in the posterior lateral line. Scale bar = 10 μm. (E) Confocal imaging analysis of L1 hair cell clusters in the posterior lateral line of control and claudin h deficiency zebrafish at 72 and 96 hpf. (F,G) Quantification of the number of hair cells per L1 neuromast in the control and claudin h morphants at 72 and 96 hpf. Values with **, ***, and ****above the bars are significantly different (P < 0.01, P < 0.001, and P < 0.0001, respectively).
|