
Fig. 7
- ID
- ZDB-FIG-210428-100
- Publication
- Xia et al., 2021 - A single-cell resolution developmental atlas of hematopoietic stem and progenitor cell expansion in zebrafish
- Other Figures
- All Figure Page
- Back to All Figure Page
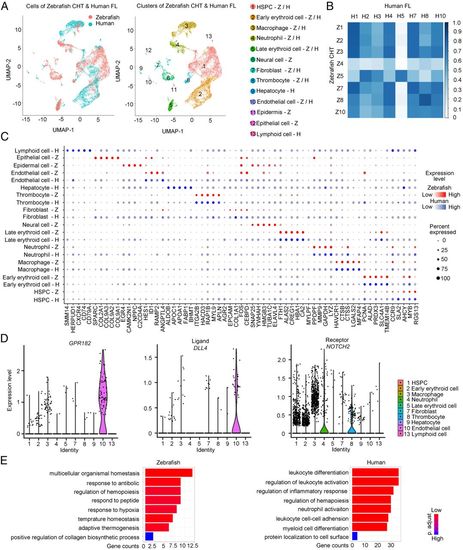
Cross-species analysis between human FL and zebrafish CHT reveals conserved and divergent gene-expression profiles. (A, Left) Unsupervised graph-based clustering of single cells from human FL (n = 8,432) and zebrafish CHT (n = 10,010) based on homologous gene-expression profiles; color labels for different species. (A, Right) Color labels for identified cell clusters. (B) Similarity matrix showing the Pearson correlations between each pair of corresponding cell clusters from human FL and zebrafish CHT based on homologous gene-expression profiles. (C) Dot plot showing the conserved signature genes of each cluster in human and zebrafish. (D) Identification of GPR182, DLL4, and NOTCH2 expression in human FL cell clusters. (E) The major GO terms of divergent HSPC genes in human FL and zebrafish CHT. |