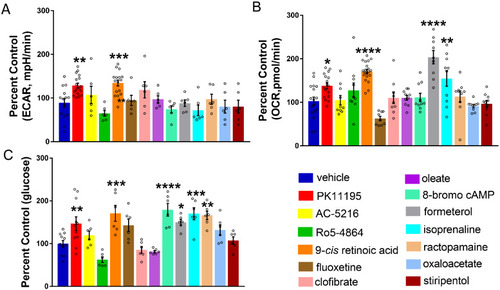
Correcting metabolic deficits and hypoglycaemia with validated pck1 activators. (A) Representative bar graph showing baseline ECAR in 6-dpf scn1lab mutants treated with pck1 activators. A significant increase was observed in ECAR for PK11195 and 9-cis retinoic acid. Data are presented as mean ± SEM normalized to wild-type controls. Statistics were performed by one-way ANOVA followed by Dunnett’s multiple comparison test with significance taken as **P < 0.01 ***P < 0.001 and ****P < 0.0001 (n = 10). (B) Representative bar graph showing baseline OCR in scn1lab mutants treated with pck1 activators. A significant increase in OCR was observed for PK11195, 9-cis retinoic acid, formoterol and isoprenaline. Data are presented as mean ± SEM normalized to wild-type controls. Statistics were performed by one-way ANOVA followed by Dunnett’s multiple comparison test with significance taken as **P < 0.01, ***P < 0.001 and ****P < 0.0001 (n = 10). (C) Representative bar graph showing glucose levels (normalized to total protein) in drug-treated scn1lab mutants. There is a significant increase in glucose levels in the scn1lab mutants treated with PK11195, 9-cis retinoic acid, formoterol, 8-bromo-cAMP and ractopamine, compared to the DMSO control (vehicle). Data are presented as mean ± SEM normalized to wild-type controls. Statistics were performed by one-way ANOVA followed by Dunnett’s multiple comparison test with significance taken as *P < 0.05, **P < 0.01 and ***P < 0.001. Values represent averages from n = 11, vehicle, PK11195; (n = 6), other drugs, where each sample represents 10–20 pooled larvae. In all panels, WT refers to wild-type larvae.
|
