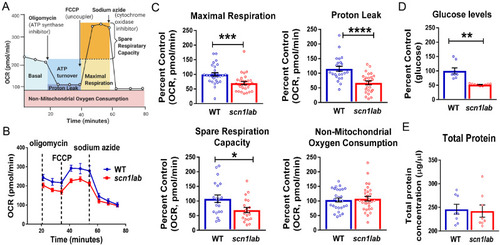
The scn1lab mutants have impaired mitochondrial bioenergetics and are hypoglycemic. (A) A schematic representation of a complete metabolic profile of mitochondrial respiration for measuring different mitochondrial indices using the XF Seahorse Mito Stress Test. Agilent Technologies, Inc.© 2020, adapted and reproduced with permission, courtesy of Agilent Technologies, Inc. Figure created with BioRender.com. (B) The Seahorse Bioanalyzer was used to measure OCR in 6-dpf scn1lab and wild-type larvae by sequentially adding oligomycin, FCCP and sodium azide (instead of antimycin A/rotenone). A representative OCR profile plot from a single run represents decreased OCR in scn1lab mutant compared to wild-type group. (C) Bar graphs represent mitochondrial metabolic parameters. There is a significant decrease in maximal respiration, proton leak and spare respiratory capacity in scn1lab mutants compared to the wild-type larvae. There is no significant difference in non-mitochondrial consumption rate. Data are presented as mean ± SEM and are normalized to the control group (wild type). Statistics performed by unpaired-t test with Welch’s correction. Asterisks (*) indicate a significance of difference between the two groups at *P < 0.05, **P < 0.01 and ***P < 0.001 and ****P < 0.0001; the data points represent each larva, n = 20 for each group. (D) Representative bar graph depicting glucose levels in 6-dpf scn1lab and wild-type larvae. There is a significant decrease in glucose levels in the scn1lab mutants compared to the wild-type larvae. Data are presented as mean ± SEM and are normalized to the control group (wild type). (E) Representative bar graph depicting total protein levels in 6-dpf scn1lab and wild-type larvae. No significant difference is observed in the total protein levels between the two groups. Data are presented as mean ± SEM. For (D) and (E), statistics were performed by unpaired-t test with Welch’s correction. Asterisks (*) indicate a significance of difference between the two groups at **P < 0.01. n = 8, where each sample represents 20 pooled larva. In all panels, WT refers to wild-type larvae.
|
