IMAGE

Figure 4

ID
ZDB-IMAGE-210414-32
Source
Figures for Banerji et al., 2021
Image
Figure Caption

Figure 4

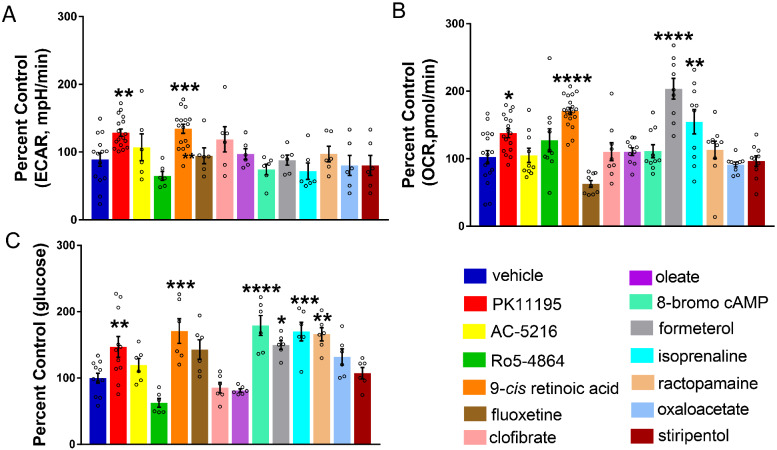
Correcting metabolic deficits and hypoglycaemia with validated pck1 activators. (A) Representative bar graph showing baseline ECAR in 6-dpf scn1lab mutants treated with pck1 activators. A significant increase was observed in ECAR for PK11195 and 9-cis retinoic acid. Data are presented as mean ± SEM normalized to wild-type controls. Statistics were performed by one-way ANOVA followed by Dunnett’s multiple comparison test with significance taken as **P <0.01 ***P <0.001 and ****P <0.0001 (n = 10). (B) Representative bar graph showing baseline OCR in scn1lab mutants treated with pck1 activators. A significant increase in OCR was observed for PK11195, 9-cis retinoic acid, formoterol and isoprenaline. Data are presented as mean ± SEM normalized to wild-type controls. Statistics were performed by one-way ANOVA followed by Dunnett’s multiple comparison test with significance taken as **P <0.01, ***P <0.001 and ****P <0.0001 (n = 10). (C) Representative bar graph showing glucose levels (normalized to total protein) in drug-treated scn1lab mutants. There is a significant increase in glucose levels in the scn1lab mutants treated with PK11195, 9-cis retinoic acid, formoterol, 8-bromo-cAMP and ractopamine, compared to the DMSO control (vehicle). Data are presented as mean ± SEM normalized to wild-type controls. Statistics were performed by one-way ANOVA followed by Dunnett’s multiple comparison test with significance taken as *P <0.05, **P <0.01 and ***P <0.001. Values represent averages from n = 11, vehicle, PK11195; (n = 6), other drugs, where each sample represents 10–20 pooled larvae. In all panels, WT refers to wild-type larvae.

Acknowledgments
This image is the copyrighted work of the attributed author or publisher, and ZFIN has permission only to display this image to its users. Additional permissions should be obtained from the applicable author or publisher of the image. Full text @ Brain Commun