
Fig. 5
- ID
- ZDB-FIG-210324-47
- Publication
- Costantini et al., 2020 - Novel RPL13 variants and variable clinical expressivity in a human ribosomopathy with spondyloepimetaphyseal dysplasia
- Other Figures
- All Figure Page
- Back to All Figure Page
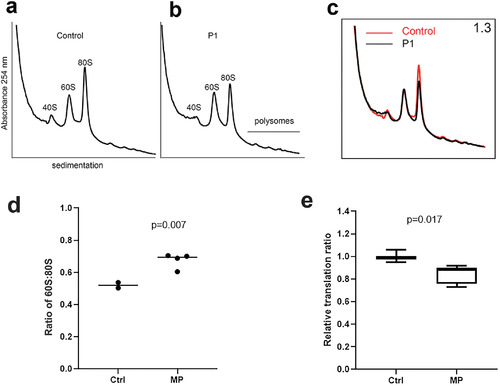
Sucrose profiles and global translation in patients 1, 2, and 3. Comparison of ribosomal fractions from fibroblasts of healthy control parent (A) and affected patient 1 (P1) heterozygous for the p.A178D RPL13 mutation (B). (C) Overlay of sucrose gradient profiles derived from healthy control parent (red line) and affected individual P1 (black line). Ribosomal subunit ratio (60S:80S) is indicated in the top right corner. (D) Box plot showing the results of the 60S:80S from fibroblasts of healthy controls (parents of patient 1) and mutation‐positive (MP) subjects (patients 1 to 3 and mother of patient 2), each of whom is heterozygous for an RPL13 mutation. An increase median value for the 60S:80S ratio is observed in the MP group. The p value from one‐sample t test comparing mutation‐positive group against the median of the control samples. (E) Relative translation ratio from OP‐puro translation assay. Global protein rate is reduced in the MP subjects (patients 1 to 3 and mother of patient 2) compared with controls (n = 2). Data are presented as mean and interquartile range. Experiments were performed twice, in duplicate or triplicate/donor/experiment, and analyzed using Mann–Whitney U test. |