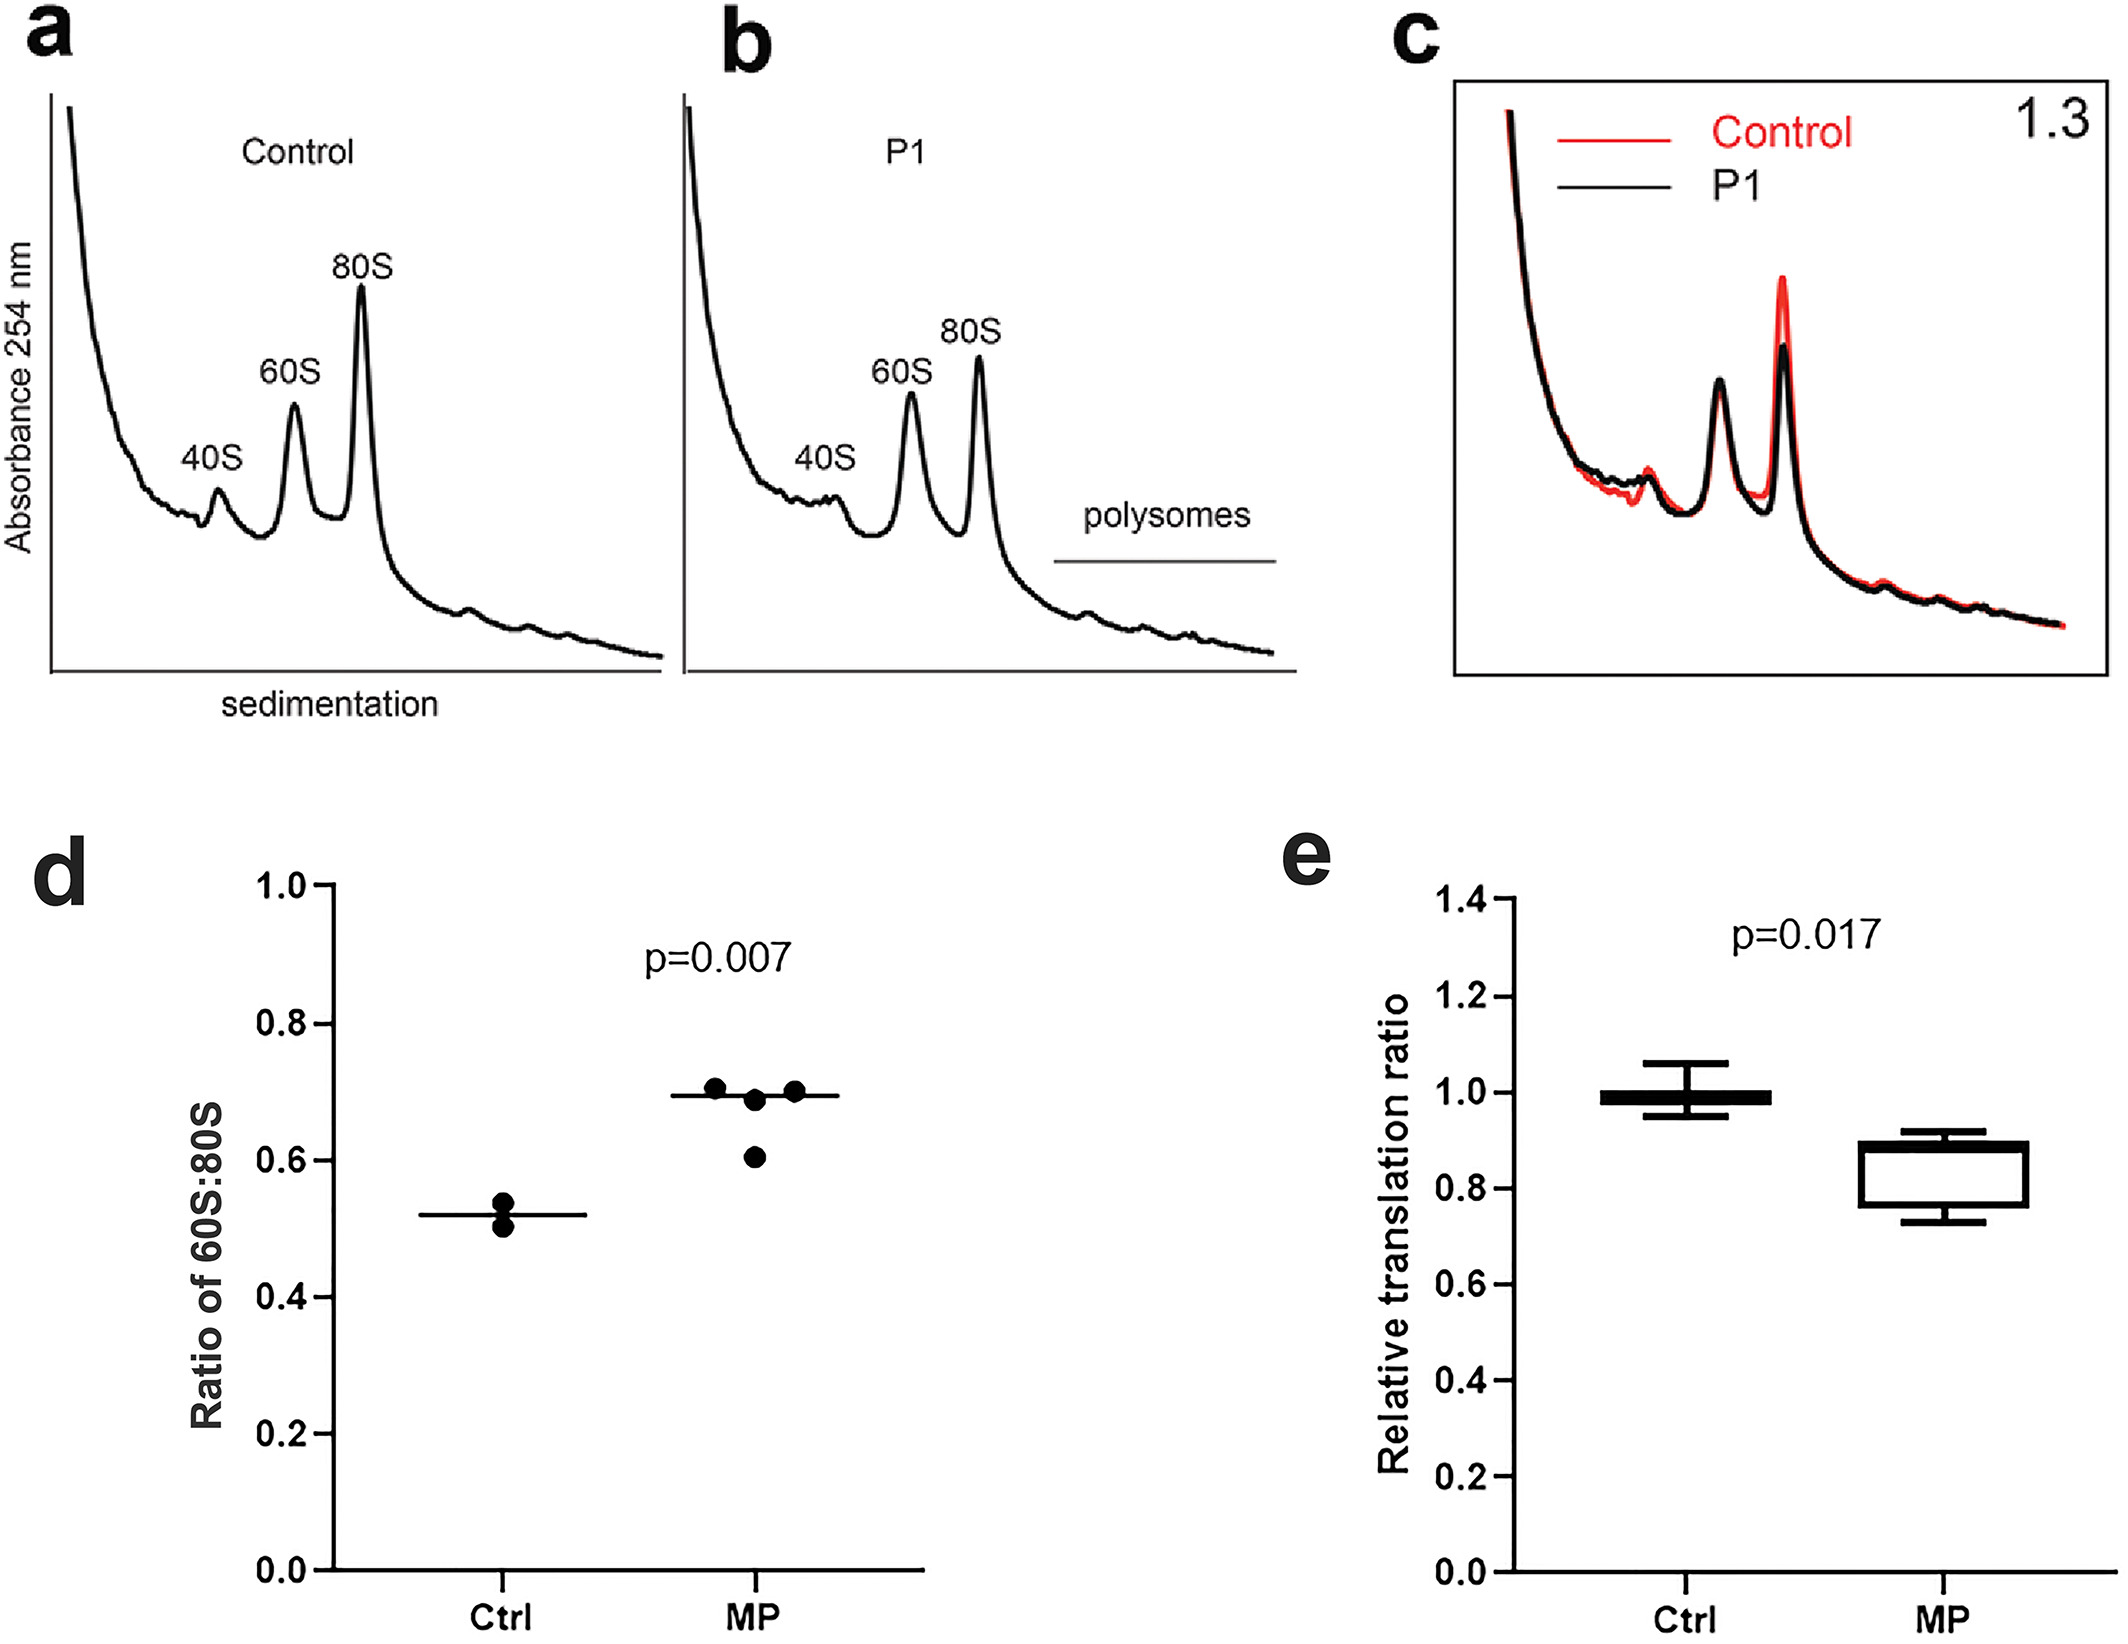
Fig. 5 Sucrose profiles and global translation in patients 1, 2, and 3. Comparison of ribosomal fractions from fibroblasts of healthy control parent (A) and affected patient 1 (P1) heterozygous for the p.A178D RPL13 mutation (B). (C) Overlay of sucrose gradient profiles derived from healthy control parent (red line) and affected individual P1 (black line). Ribosomal subunit ratio (60S:80S) is indicated in the top right corner. (D) Box plot showing the results of the 60S:80S from fibroblasts of healthy controls (parents of patient 1) and mutation?positive (MP) subjects (patients 1 to 3 and mother of patient 2), each of whom is heterozygous for an RPL13 mutation. An increase median value for the 60S:80S ratio is observed in the MP group. The p value from one?sample t test comparing mutation?positive group against the median of the control samples. (E) Relative translation ratio from OP?puro translation assay. Global protein rate is reduced in the MP subjects (patients 1 to 3 and mother of patient 2) compared with controls (n =?2). Data are presented as mean and interquartile range. Experiments were performed twice, in duplicate or triplicate/donor/experiment, and analyzed using Mann?Whitney U test.
Image
Figure Caption
Acknowledgments
This image is the copyrighted work of the attributed author or publisher, and
ZFIN has permission only to display this image to its users.
Additional permissions should be obtained from the applicable author or publisher of the image.
Full text @ J. Bone Miner. Res.

