|
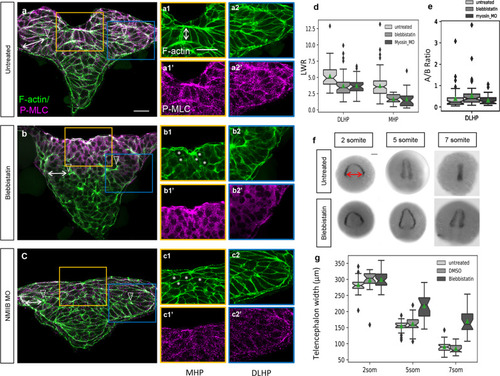
Role of non-muscle myosin II in apical constriction and neural fold convergence.a–c2’ Transverse sections through the ANP of 5 somuntreated (a–a2’), blebbistatin-treated (b–b2’) and NMIIB MO-injected embryos (c–c2’). Embryos were labeled with phalloidin (F-actin, green) and anti-P-MLC (magenta). d Length-width ratio distributions for DLHP and MHP cells from untreated, blebbistatin-treated, and NMIIB MO-injected embryos. DLHP measurements: untreated: n = 50 cells (five embryos), mean = 5.22; blebbistatin-treated: n = 58 cells (four embryos), mean = 3.70; NMIIB MO-injected: n = 38 cells (three embryos), mean = 3.74. MHP measurements: untreated: n = 115 cells (four embryos), mean = 3.70 (same data as in Fig. 6 c2); blebbistatin-treated: n = 35 cells (four embryos), mean = 1.70; NMIIB MO-injected: n = 24 cells (3 embryos), mean = 1.68. Two-sided Mann–Whitney U test: DLHP: untreated vs blebbistatin: P = 1.30e−6, AUC = 0.771; untreated vs NMIIB MO-injected: P = 2.14e−5, AUC = 0.766; blebbistatin vs NMIIB MO-injected: P = 0.325, AUC = 0.440; MHP: untreated vs blebbistatin: P = 3.55e−12, AUC = 0.889; untreated vs NMIIB MO-injected: P = 3.50e−8, AUC = 0.859; blebbistatin vs NMIIB MO-injected: P = 0.343, AUC = 0.574. e Apical-to-basal length ratios of DLHP cells for untreated, blebbistatin-treated, and NMIIB MO-injected embryos, same cells quantified as in d. Two-sided Mann–Whitney U test: untreated vs blebbistatin-treated P = 0.00665, AUC = 0.348; blebbistatin-treated vs NMIIB MO-injected: P = 0.00827, AUC = 0.660; untreated vs NMIIB MO-injected: P = 0.930, AUC = 0.494. f Dorsal views of 2, 5, and 7 som embryos untreated or blebbistatin-treated labeled via in situ hybridization using an emx3 riboprobe. g Boxplots showing the distribution of telencephalon widths (double red arrow in f) according to treatment group. Notches depict the 95% confidence interval around the median and green triangles depict distribution means. 2 som: untreated: n = 26, mean = 283.224; DMSO-treated: n = 26, mean = 297.727; blebbistatin-treated: n = 34, mean = 299.412. 5 som: Untreated: n = 33, mean = 154.688; DMSO: n = 30, mean = 161.747; blebbistatin-treated: n = 23, mean = 217.472. Two-sided Mann–Whitney U test: 5 somuntreated vs DMSO: P = 0.332, AUC = 0.428; 5 somuntreated vs blebbistatin-treated: P = 1.30e−7, AUC = 0.0817; 5 som DMSO-treated vs blebbistatin-treated: P = 3.50e−6, AUC = 0.125. 7 som: untreated: n = 28, mean = 90.444; DMSO-treated: n = 27, mean 84.855; blebbistatin-treated: n = 24, mean = 169.779. Two-sided Mann–Whitney U test: 7 somuntreated vs DMSO: P = 0.170, AUC = 0.608; 7 som untreated vs blebbistatin-treated: P = 2.06e−9, AUC = 0.0140; 7 som DMSO-treated vs blebbistatin-treated: P = 1.46e−9, AUC = 0.00435. Annotations: double white arrows = cell length in deep layer; open arrowhead = DLHP; asterisks = rounded neuroectodermal cells; red double arrow = posterior-most telencephalon width. Scale bars: 25 μm in a and a1; 100 μm in f.
|