|
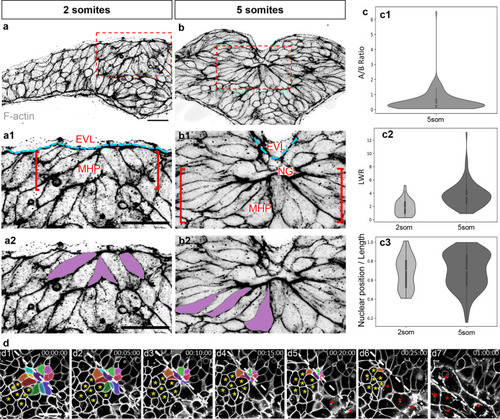
Apical constriction of MHP cells.a–b2 Transverse sections through the ANP at the 2 (a, a1, a2) and 5 (b, b1, b2) som stages labeled with phalloidin (shown in greyscale). a1–b2 are higher magnifications of the boxed areas in a and b, revealing the organization of the medial ANP (a1, b1) and the shape of individual MHP cells pseudo-colored in purple (a2, b2). c Quantification of cell shape changes. Boxplot elements within the violin plots depict quartiles with the centerline depicting the median. c1 Measurements of apical:basal surface ratio at 5 som (n = 115 cells from four embryos, mean = 0.548). c2 Measurement of length-to-width (LWR) ratio at 2 som (n = 47 cells from 5 embryos, mean = 1.88) and 5 som (same cells as in c1, mean=3.70). A Mann–Whitney two-sided U Test revealed that the LWR increase between 2 som and 5 som is statistically significant (P = 7.80e−11, AUC = 0.176). c3 Relative position of nucleus at 2 and 5 som measured in the same cell populations (c2). Mean nuclear position/cell length (0.682 at 2 som vs 0.696 at 5 som) is not statistically significant using a Mann–Whitney U test (P = 0.419, AUC = 0.460). d Still frames of time-lapse movie of mGFP-labeled embryo imaged from a dorsal view. Individual MHP cells are pseudo-colored, a cluster of cells adjacent to the MHP is indicated with yellow asterisks and EVL cells are labeled with red asterisks. EVL enveloping layer, MHP medial hingepoint; NG neural groove. Annotations: white dashed line = midline, red brackets = MHP region, blue dashed lines = outlines EVL, yellow asterisks: cells adjacent to MHP, red asterisks: EVL cells. Scale bars: 25 μm in a, a1, and a2; 10 μm in d1.
|