|
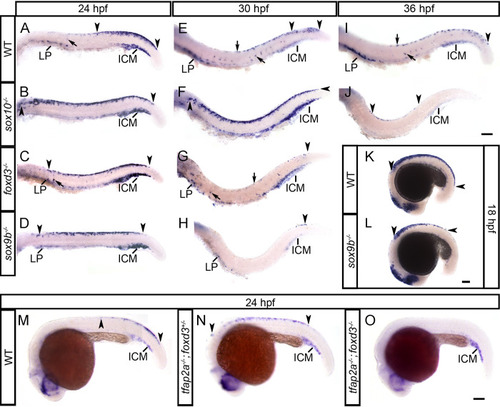
<italic>tfec</italic> is a member of the GRN functioning to specify multipotent NCCs, following their induction.In sox10, foxd3 and sox9b mutants (B,C,D) at 24 hpf, tfec-positive late Cbls are trapped in the premigratory domain along the trunk, whereas in the WT (A) they are restricted to the dorsal tail (regions between arrowheads). Consistent with failed or delayed development of NC progenitors, migrating (arrow) and LP-located Ib(sp) (A) are reduced (C,D) or completely absent (B). The anterior expansion of the progenitor domain is more pronounced in sox10 mutants (B). Initiation of expression in eNCCs, detected by posterior-most boundary of expression (posterior arrowhead), is normal in sox10 (B) and foxd3 (C) mutants, but is perceptibly delayed in sox9b mutants (D); this effect is also prominent at 18 hpf (L). In 30 hpf WT embryos (E) tfec transcript is detectable in premigratory late Cbls of the posterior tail (region within arrowheads). This domain still shows a dramatic expansion in sox10 mutants (F, arrowheads), while foxd3 (G) and sox9b (H) mutants no longer present with trapped progenitors. Instead, very few tfec+ cells are detectable in the dorsal tail (arrowheads), and there is a prominent reduction in Ib(df) (arrows, lateral patches). (I) In WT embryos at 36 hpf, tfec is still expressed in premigratory Cbls in the posterior-most tail (arrowhead), as well as Ib(df) (arrows). In sox10 mutants (J) trapped premigratory progenitors (region within arrowheads) are reduced, but still visible. tfec expression in the premigratory NC domain (region within arrowheads) is anteriorly shifted in single tfap2a mutants (N), compared to WT siblings (M) at 24 hpf, but completely eliminated in double tfap2a;foxd3 mutants (O). tfec expression is invariably detectable in the intermediate cell mass from 18 hpf to 36 hpf, in WT and mutant embryos (A-O). ICM, intermediate cell mass; LP, lateral patches. Lateral views, head towards the left. Scale bars: 100 μm.
|

