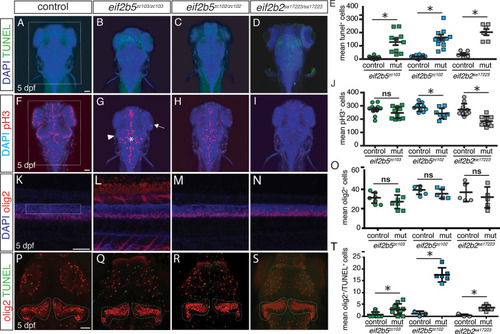
eif2b mutants demonstrate abnormal CNS development. Confocal images, z-stack maximal projections. (A?I), dorsal views of the brain, rostral to the top, scale bar 50 ?m; (K?N), lateral views of spinal cord, dorsal to the top, scale bar 50 um. (P?S), dorsal views of brain, rostral to top, scale bar 50 ?m. *p<0.05. (A?D) TUNEL and DAPI staining shows increased apoptosis in homozygous mutant alleles compared to controls (wild-type and heterozygous siblings) in eif2b5zc103/zc103 eif2b5zc102/zc102 and eif2b2sa17223/sa17223 mutants. (E) Quantification of mean TUNEL+ cell counts in eif2b5zc103/zc103 eif2b5zc102/zc102 and eif2b2sa17223/sa17223 mutants compared to sibling controls. (F?I) Phospho-histone 3 and DAPI staining shows decreased cell proliferation in 5 dpf eif2b2sa17223/sa17223 mutants compared to controls, while eif2b5zc103/zc103 eif2b5zc102/zc102 mutants show a change in proliferation pattern, specifically in the optic tectum. (J) Quantification of mean number pH3+ cells counts in eif2b5zc103/zc103 eif2b5zc102/zc102 and eif2b2sa17223/sa17223 mutants compared to sibling controls. (K?N) Olig2dsRed and DAPI staining shows no change in OPC counts in the spinal cords of 5 dpf eif2b5zc103/zc103 eif2b5zc102/zc102 and eif2b2sa17223/sa17223 mutants compared to controls. (O) Quantification of mean number Olig2dsRed+ counts in eif2b5zc103/zc103 eif2b5zc102/zc102 or eif2b2sa17223/sa17223 mutants compared to sibling controls. (P?S) Co-labeled Olig2dsRed+/TUNEL+ cell counts staining shows increase in Olig2dsRed+ cells undergoing apoptosis in brains of 5 dpf eif2b5zc103/zc103, eif2b5zc102/zc102, or eif2b2sa17223/sa17223 mutants compared to sibling controls. (O) Quantification of mean number of co-labeled Olig2dsRed+/TUNEL+ cell counts in eif2b5zc103/zc103, eif2b5zc102/zc102, or eif2b2sa17223/sa17223 mutants compared to sibling controls.
|
