|
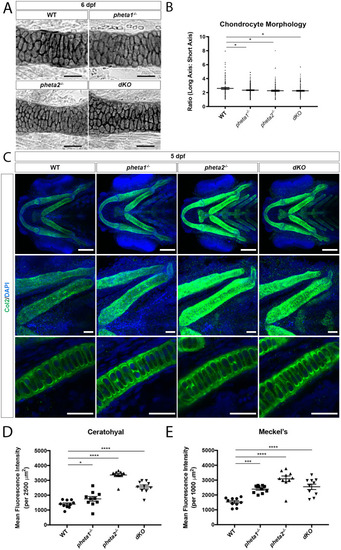
Loss of pheta1/2 disrupts chondrocyte maturation. (A) Ceratohyal cartilage, stained with Alcian Blue in flat-mount preparation. Scale bars: 50 µm. (B) Chondrocyte morphology analysis in ceratohyal cartilage (within a 200 µm2 area). (C) Top row: Z-projection ventral view of larvae immunostained for Col2 (green). Nuclei are labeled with DAPI (blue). Scale bars: 100 μm. Middle row: higher-magnification Z-projection images of corresponding ceratohyal cartilage. Scale bars: 25 μm. Bottom row: higher-magnification single optical section images of corresponding ceratohyal cartilage, depicting extracellular secretion of type II collagen. Scale bars: 25 µm. (D,E) Quantification of mean fluorescence intensity in the ceratohyal (D) and Meckel's cartilage (E) in 5 dpf larvae. *P<0.05, ***P<0.001, ****P<0.0001.
|