|
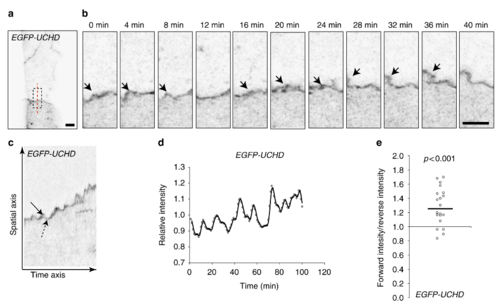
Oscillatory F-actin dynamics during remodeling of cell?cell junctions. a, b Still images from a movie (Supplementary Movie 4) showing JBL formation in the dorsal aorta of an EGFP-UCHD expressing 2dpf embryo (Tg(fli:Gal4ffubs3; UAS:EGFP-UCHDubs18)), shown in inversed contrast. b A magnification of the inset in a and the red dashed line indicates the site for kymograph in c. Arrows point to a JBL, seen as a local thickening of the junction. c Kymograph across the junction. Solid arrow denotes forward movement and dashed arrow backward movement of the junction. d Intensity plotting of a EGFP-UCHD JBL kymograph. e Scatter plot of the relative EGFP-UCHD intensity during forward and backward movements (n?=?20 events, 4 movies). EGFP-UCHD intensity value in a forward movement was divided with intensity value during subsequent reverse movement. Non-parametric one sample Wilcoxon signed rank test was used as statistical test. Scale bars 5?�m
|