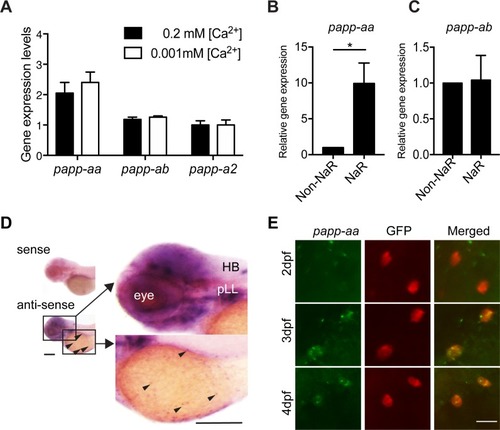
(A) Tg(igfbp5a:GFP) fish were raised in E3 embryo medium to 3 days post fertilization (dpf) and transferred to embryo media containing the indicated [Ca2+]. Eighteen hours later, NaR cells were isolated by FACS. The levels of papp-aa, papp-ab, and papp-a2 mRNA were measured and shown. Data shown are Mean ± SEM, n = 4. (B–C) NaR cells and other cells in four dpf Tg(igfbp5a:GFP) larvae were separated by FACS. The levels of papp-aa (B) and papp-ab (C) mRNA were measured and shown. *, p<0.05 by unpaired two-tailed t test. n = 3. (D) Whole mount in situ hybridization analysis of papp-aa mRNA in three dpf larvae. HB, hindbrain. pLL, posterior lateral line ganglion. Arrowheads indicate papp-aa mRNA signal in the yolk sac region. A sense cRNA probe was used as a negative control. Scale bar = 0.2 mm. (E) Tg(igfbp5a:GFP) fish of the indicated stages were analyzed by double label staining. Scale bar = 20 µm.
Excel spreadsheet containing quantitative data for <xref rid='fig1' ref-type='fig'>Figure 1</xref>.
This image is the copyrighted work of the attributed author or publisher, and
ZFIN has permission only to display this image to its users.
Additional permissions should be obtained from the applicable author or publisher of the image.
Full text @ Elife
Your Input Welcome
Thank you for submitting comments. Your input has been emailed to ZFIN curators who may contact you if
additional information is required.
Oops. Something went wrong. Please try again later.