
Figure 7
- ID
- ZDB-FIG-200208-31
- Publication
- Honkoop et al., 2019 - Single-cell analysis uncovers that metabolic reprogramming by ErbB2 signaling is essential for cardiomyocyte proliferation in the regenerating heart
- Other Figures
-
- Figure 1
- Figure 1—figure supplement 1.
- Figure 1—figure supplement 2.
- Figure 1—figure supplement 3.
- Figure 1—figure supplement 4.
- Figure 2
- Figure 3
- Figure 3—figure supplement 1.
- Figure 4
- Figure 4—figure supplement 1.
- Figure 5.
- Figure 6
- Figure 6—figure supplement 1.
- Figure 7
- Figure 7—figure supplement 1.
- All Figure Page
- Back to All Figure Page
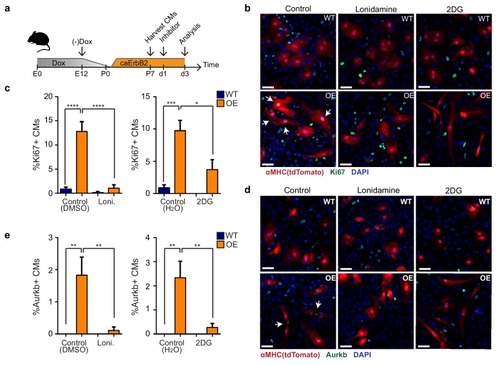
(a) Cartoon showing the experimental procedure to analyse the effects of glycolysis inhibitors (2-DG and lonidamine) on cardiomyocyte proliferation. (b) Immunofluorescence analysis on P7 cardiac cultures derived from WT and caErbB2 OE hearts that are endogenously fluorescent for tdTomato under the MYH6 promoter, stained for the cell-cycle marker Ki67. Arrows point at Ki67+ CMs. (c) Quantification of % Ki67+ CMs from WT and caErbB2 OE derived from P7 cardiac cultures treated with the glycolysis inhibitors 2-DG (n = 4 for WT and n = 4 for OE), and lonidamine (n = 7 for WT and n = 4 for OE) or their diluents as controls. (d) Immunofluorescence analysis on P7 cardiac cultures derived from WT and caErbB2 OE hearts that are endogenously fluorescent for tdTomato under the MYH6 promoter, stained for the cytokinesis marker Aurora kinase B. Arrows point at Aurkb+ CMs. (e) Quantification of % Aurkb+ CMs from WT and caErbB2 OE derived from P7 cardiac cultures treated with the glycolysis inhibitors 2-DG (n = 4 for WT and n = 4 for OE), and lonidamine (n = 7 for WT and n = 4 for OE) or their diluents as controls. In all panels, bars represent the mean, and error bars represent s.e.m *p<0.05, **p<0.01, ***p<0.001, ****p<0.0001, Scale bars represent 50 ?m. |