
Figure 3
- ID
- ZDB-FIG-200208-24
- Publication
- Honkoop et al., 2019 - Single-cell analysis uncovers that metabolic reprogramming by ErbB2 signaling is essential for cardiomyocyte proliferation in the regenerating heart
- Other Figures
-
- Figure 1
- Figure 1—figure supplement 1.
- Figure 1—figure supplement 2.
- Figure 1—figure supplement 3.
- Figure 1—figure supplement 4.
- Figure 2
- Figure 3
- Figure 3—figure supplement 1.
- Figure 4
- Figure 4—figure supplement 1.
- Figure 5.
- Figure 6
- Figure 6—figure supplement 1.
- Figure 7
- Figure 7—figure supplement 1.
- All Figure Page
- Back to All Figure Page
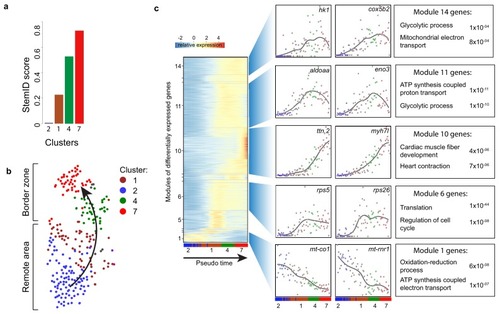
(a) Bar plot of StemID scores for the cardiomyocyte clusters (clusters #2, 1, 4 and 7) calculated by the formula: number of significant links for each cluster multiplied by the median transcriptome entropy across all cells in a cluster. (b) Cardiomyocyte clusters from adult injured heart. Arrow indicates the dedifferentiation path derived from the StemID scores. (c) Pseudo time analysis. Left; one-dimensional SOM of z-score transformed expression profiles along the differentiation trajectory incurred by StemID analysis. Y-axis represents the fourteen modules with differentially expressed genes. X-axis represents the pseudo time in which the cells were ordered. Middle; expression profiles of representative genes of the major modules. Y-axis shows transcript counts. X-axis represents the pseudo time. Right; Major gene ontology terms derived from all genes expressed in the module with p-values. |