Figure 4—figure supplement 1.

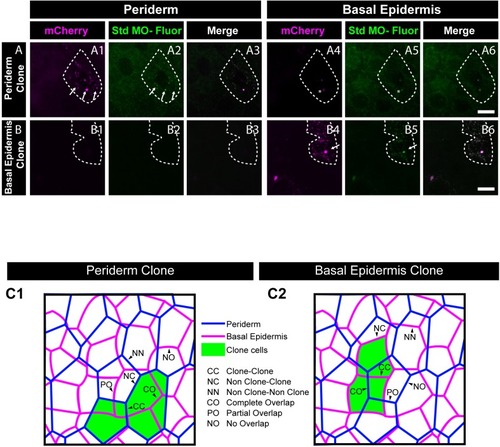
Analysis of co-segregation of 3’- Carboxyfluorescein Standard Morpholino and mCherry; schematic showing classification of boundaries used for E-cadherin quantifications.

Morpholino tagged with Carboxyfluorescein (A2, B2, A5, and B5) and mCherry (A1, B1, A4 and B4) showing co-segregation in peridermal clones (A1–A3) but no localisation in basal epidermis (A4–A6). Similarly, clones in basal epidermis showing co-localisation with mCherry (B4–B6) but no localisation in periderm (B1–B3). Arrows point to cells showing co-segregation of labelled morpholino and mCherry. Dotted line in (A1, A2, A3) represents the position of the peridermal clone and the basal epidermal region below the clone (A4, A5, A6). Similarly, dotted lines in (B4, B5, and B6) mark the clones in the basal epidermis and the peridermal region above the clone (B1, B2, and B3). Asterisk marks fluorescence bleed through. Scale bar represents 10 µm (A6, B6). Std MO- Fluor = 3’- Carboxyfluorescein Standard Morpholino. Schematic (C1, C2) showing different types of boundaries defined for quantifications. The two epidermal layers, periderm (blue) and basal epidermis (magenta), overlaid on top of each other having either peridermal clone (green in C1) or basal epidermal clone (green in C2). Arrowheads demonstrate different types of boundaries namely, clone-clone (CC), Non-clone-Clone (NC), and Non clone-Non clone (NN) for analysing layer autonomous effect and complete overlap (CO), partial overlap (PO), and no overlap (NO) (C1, C2) for analysis of layer non autonomous effect.

Expression Data

Expression Detail
Antibody Labeling
Phenotype Data

Phenotype Detail
Acknowledgments
This image is the copyrighted work of the attributed author or publisher, and ZFIN has permission only to display this image to its users. Additional permissions should be obtained from the applicable author or publisher of the image. Full text @ Elife