
Figure 4
- ID
- ZDB-FIG-200125-31
- Publication
- Arora et al., 2020 - Stepwise polarisation of developing bilayered epidermis is mediated by aPKC and E-cadherin in zebrafish
- Other Figures
-
- Figure 1
- Figure 1—figure supplement 1.
- Figure 1—figure supplement 2.
- Figure 1—figure supplement 3.
- Figure 1—figure supplement 4—source data 2.
- Figure 2
- Figure 2—figure supplement 1.
- Figure 2—figure supplement 2.
- Figure 2—figure supplement 3—source data 4.
- Figure 2—figure supplement 4—source data 2.
- Figure 3
- Figure 4
- Figure 4—figure supplement 1.
- Figure 4—figure supplement 2—source data 9.
- Figure 4—figure supplement 3.
- Figure 5
- Figure 5—figure supplement 1.
- Figure 5—figure supplement 2.
- Figure 5—figure supplement 3.
- Figure 5—figure supplement 4.
- All Figure Page
- Back to All Figure Page
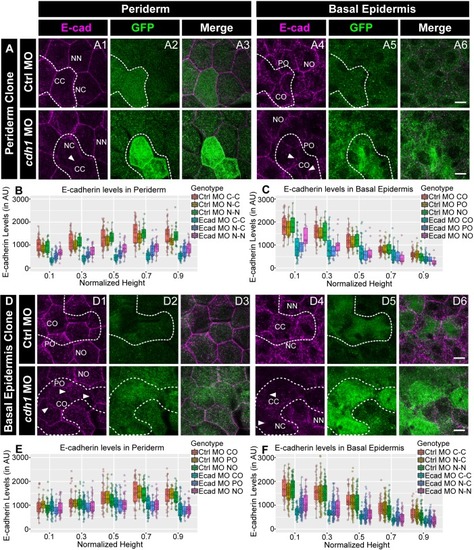
Confocal images of E-cadherin (magenta) localisation in GFP clones (green) carrying cadherin-1 morpholino (cdh-1 MO) and control morpholino (Ctrl MO) in the periderm (A) and basal epidermis (D). (A1–A3) shows peridermal clone and its effect on E-cadherin localisation in the basal epidermal cells (A4–A6). (D4–D6) show a basal epidermis clone and its effect on E-cadherin localisation in the periderm (D1–D3). Graphs showing effect on E-cadherin levels across normalised cell height in the periderm (B, E) and basal epidermis (C, F) across different boundaries upon knockdown of e-cadherin in a clonal manner. The boundaries Clone-Clone (C–C), Clone-Non-clone (N–C), and Non clone-Non clone (N–N) are within the same layer with respect to the clones whereas boundaries showing Complete Overlap (CO), Partial Overlap (PO), and No Overlap (NO) are in the cells of the juxtaposed layer. Dotted line in (A1, A2) represents the position of the peridermal clone and the basal epidermal region below the clone (A4, A5). Similarly, dotted lines in (D4, D5) mark the clones in the basal epidermis and the peridermal region above the clone (D1, D2). Arrowheads point to the loss/reduction in E-cadherin staining at the cell membranes. Scale bar represents 10 µm in (A6, D6). AU = Arbitrary Units. Source file with fluorescence intensities for peridermal clone and E-cadherin analysis at the boundaries in the periderm (B) and basal epidermis (C) is available as Figure 4—source data 1 and 2, respectively. Fluorescence intensities for basal epidermal clones and analysis at the boundaries in periderm (E) and basal epidermis (F) is available as Figure 4—source data 3 and 4, respectively. Statistical analysis consisting of intensity comparisons is available as Figure 4—source data 5. |